How to use different Dashboard and Dashboard Tab features
Click on the links to jump to a dashboard!
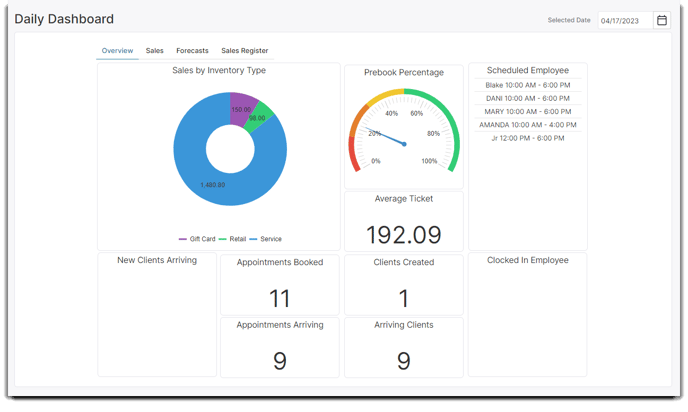
Daily Dashboard
The Daily Dashboard is a quick and easy way to see critical business information for the day. This screen can be used as the default start screen or simply as a reference on how the business is doing for a particular date. If the selected date is today's date, this shows the information as of the current time for today.
Selected Date
Choose the date of the statistics you wish to view.
Sales by Inventory Type
This graph shows the date's sales broken down by type.
New Clients Arriving
This section shows the number of new clients arriving on the selected date.
Arriving Clients
This section displays the number of clients booked for the selected day.
Average Ticket
Shown here is the average ticket amount for today's sales.
Prebook Percentage
This graph shows the percentage of prebooked appointments made today.
Scheduled Employees
This section shows the employees scheduled to work on the selected date. This comes from the employee schedules.
Appointments Booked
This section shows the number of appointments made today. The appointments created can be for any day.
Appointments Arriving
This section shows the number of appointments for the selected day.
Clocked In Employees
This section shows the employees who clocked in and the time that they clocked in.
_________________________________________
Sales Dashboard Tab
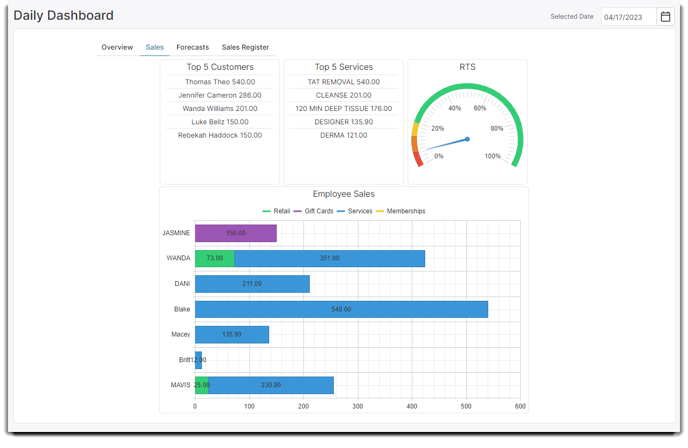
Top 5 Customers
The five clients who have spent the most money on the selected day will show here.
Top 5 Services
The five services that have earned the most money on the selected day will show here.
RTS
This small graph shows the business's retail to service percentage for the selected date.
Employee Sales Graph
This section shows the sales by each employee, broken down into the types of items sold. Hovering over an employee on this graph will open a detailed breakdown.
_______________________________________
Forecast Dashboard Tab
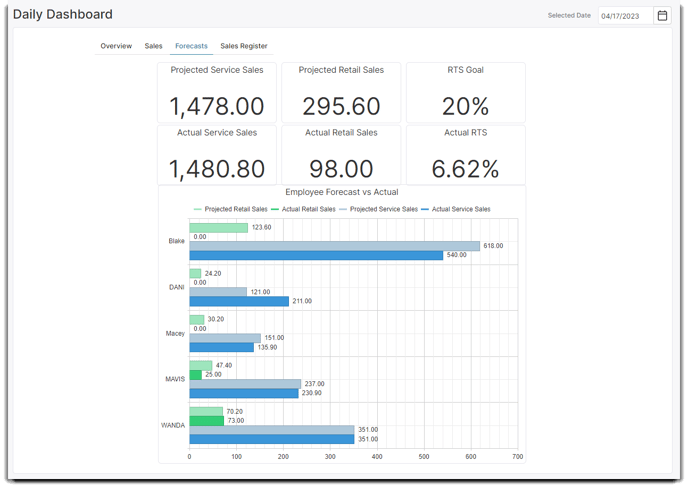
Projected Service Sales
This section shows the service sales estimated to be performed for the selected date.
Projected Retail Sales
This section shows the retail sales estimated to be made for the selected date.
RTS Goal
This section shows the retail to service percentage goal for the selected date.
Actual Service Sales
This section shows the service sales made for the selected date. If the date is today's date, this shows the service sales made so far today.
Actual Retail Sales
This section shows the retail sales made for the selected date. If the date is today's date, this shows the retail sales made so far today.
Actual RTS
This section shows the retail to service percentage for the selected date. If the date is today's date, this shows the retail to service percentage so far today.
Employee Forecast vs Actual Graph
This graph displays the projected and actual totals per employee.
______________________________________
Sales Register Dashboard Tab
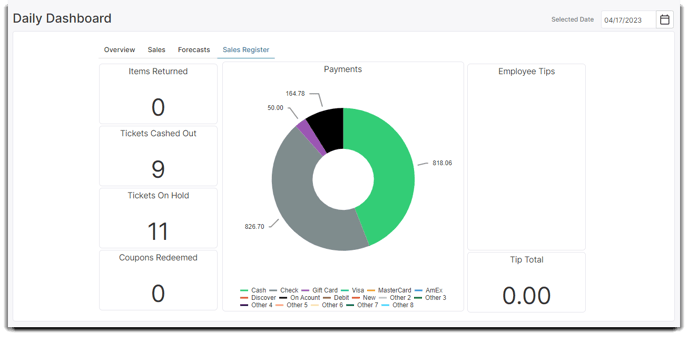
Items Returned
This section shows the number of items returned in the sales register.
Tickets Cashed Out
This section shows the number of tickets rung through the sales register.
Tickets on Hold
This section shows the number of tickets on hold in the sales register.
Coupons Redeemed
This section shows the number of coupons used in the sales register. These can be item coupons or ticket coupons.
Payments Graph
This graph shows payments made, broken down by payment type.
Employee Tips
This section shows the tips per employee, as allocated in the sales register.
Tip Total
This section displays the total amount of tips received.
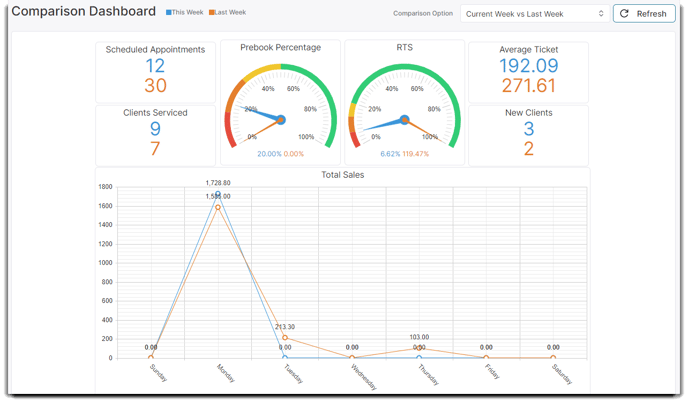
Comparison Dashboard
The Comparison Dashboard is available in the Preferred & Ultimate editions of Envision. To upgrade, please contact our Sales Team at 800.231.9445 or sales@ennoview.com.
The comparison dashboard shows business information in a date range, as compared to a second date range. This allows your business to analyze differences in your performance over time! Choose the date range selections to the upper right of the screen in the comparison options, and click the refresh button to update the information if the date ranges are adjusted.
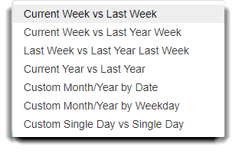
Comparison Option
Select the date range options you wish to compare from the dropdown.
Refresh
Click the refresh button to update the numbers for the comparison date selections.
Scheduled Appointments
The number of appointments on the appointment calendar in the comparison date selections.
Clients Serviced
The number of clients who had services performed in the comparison date selections.
Prebook Percentage
This graph shows the percent of prebooks for appointments in the comparison date selections.
RTS
This graph shows the retail to service percentages for the comparison date selections.
Average Ticket
The average dollar amount for transactions in the comparison date selections.
New Clients
The number of new clients in the comparison date selections.
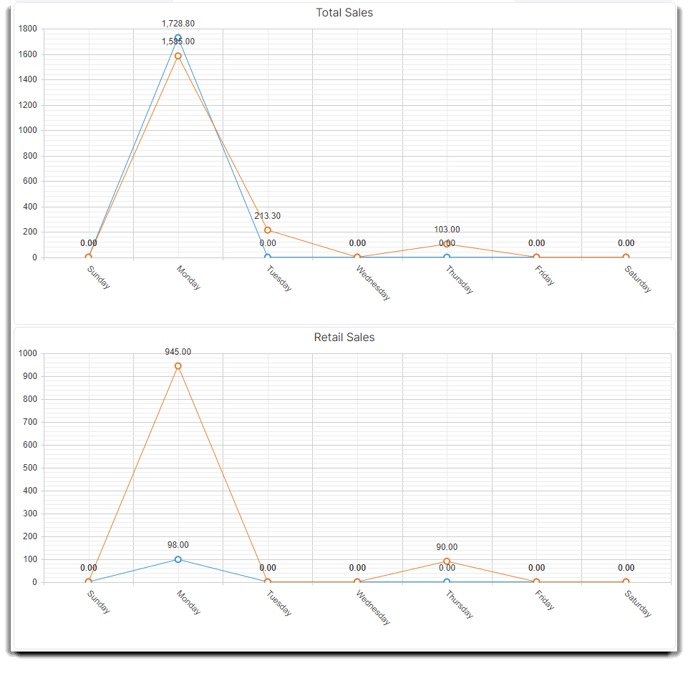
Total Sales
This graph shows the total sales in the comparison date selections. Further down the page, the sales are separated into retail, service, gift card sales, and memberships.
Forecast Dashboard
The Forecast Dashboard is available in the Preferred & Ultimate editions of Envision. To upgrade, please contact our Sales Team at 800.231.9445 or sales@ennoview.com.
The forecast dashboard allows you to view projected sales, based on appointments that are booked on the schedule for the selected date range. This is different from the Daily Dashboard's Forecast screen, which only reflects a single day. This forecast allows for you your business to look towards upcoming appointments and strive to exceed your projections!
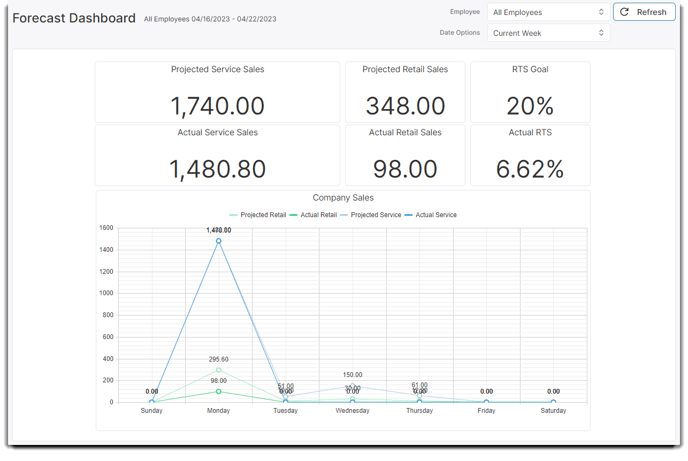
Projected Service Sales
This section shows the service sales estimated to be performed for the selected date range.
Projected Retail Sales
This section shows the retail sales estimated to be made for the selected date range. This number comes from multiplying the projected service sales by the RTS goal percentage.
RTS Goal
This reflects the RTS goal entered in the Company Settings.
Actual Service Sales
This section shows the service sales made for the selected date range. If the date range includes today's date, this shows the service sales made so far.
Actual Retail Sales
This section shows the retail sales made for the selected date range. If the date includes today's date, this shows the retail sales made so far.
Actual RTS
This section shows the retail to service percentage for the selected date range. If the date includes today's date, this shows the retail to service percentage so far.
Forecast vs Actual Graph
This graph displays the projected and actual totals per day.
Performance Dashboard
The Performance Dashboard is available in the Preferred & Ultimate editions of Envision. To upgrade, please contact our Sales Team at 800.231.9445 or sales@ennoview.com.
The Performance Dashboard allows you to compare a metric, like Service Sales, between current dates and previous dates. This dashboard allows your team to compare their performance to different periods of time, giving them insight into their growth and points of improvement. If you would like employees to only be able to view their own performance information, this can be set in Security Profiles.
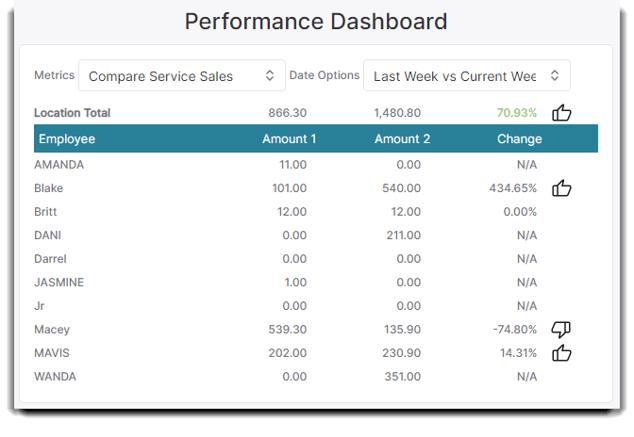
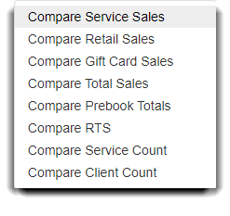
Metrics
Choose the metric that you wish to focus the comparison on. These diverse options allow your business to focus on various aspects of their performance.
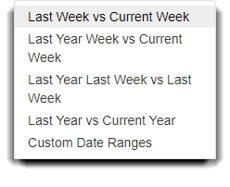
Date Options
Select the date range that you wish to compare for and against. You may set any date range you like using the Custom Date Ranges selection.
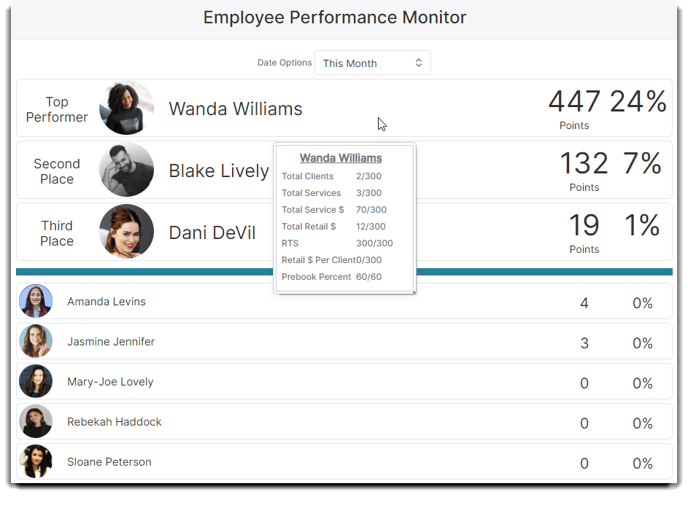
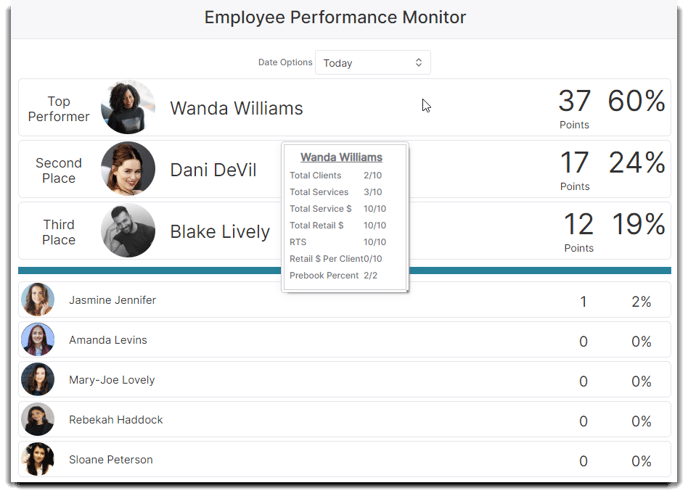
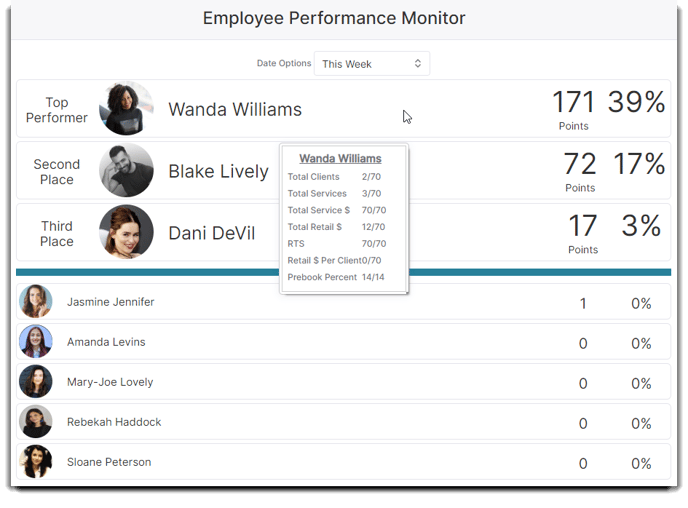
Performance Monitor
The Performance Plan and Performance Monitor are available in the Ultimate edition of Envision. To upgrade, please contact our Sales Team at 800.231.9445 or sales@ennoview.com.
The performance monitor shows real-time information based on how your staff is performing compared to the Performance Plan goals set. The performance monitor gives your business real-time data that'll help to guide and motivate your employees!
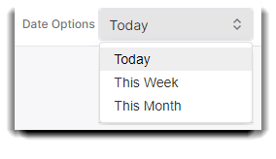
Today:
This Week:
This Month: