Full details about each Business Analysis Report
Retention - Active Clients
The Active Retention by Company report shows business retention information about clients who visited the business in the selected date range. With this report, you can gauge whether your business is successfully keeping its client and utilize this data to improve client retention!
Options Include:
- Detail or Summary
- Visit Date Range Selection
- Additional Options
- Sort By Options
This report displays the following information:
- Client Name
- First Visit Date
- Retained (Yes/No)
- Number of Return Visits
- Home Phone
- Mobile Phone
- Numbers of Clients, Retained & Not (Both)
- Percent Retained (Both)
Important Note for Retention Reports:
- It is common for business totals to not match employee totals when it comes to retention.
The reason for that is this:
A new client comes in and sees 2 different providers. Each provider gets credit for this new client since this client is new to each employee. For the business as a whole, this is just one client.
That means that when you add up each individual employee totals that this client will count twice. When you look at the business report this client will only count once since, from the business's point of view, it is just one client.
Retained clients work the same way. If a client comes in to see one provider and then comes again a week later for a different provider then neither employee gets credit for retention since neither one really retained the client (at least not yet).
From the business’s point of view, the client is retained since it was a new client who came back.
Report Example:
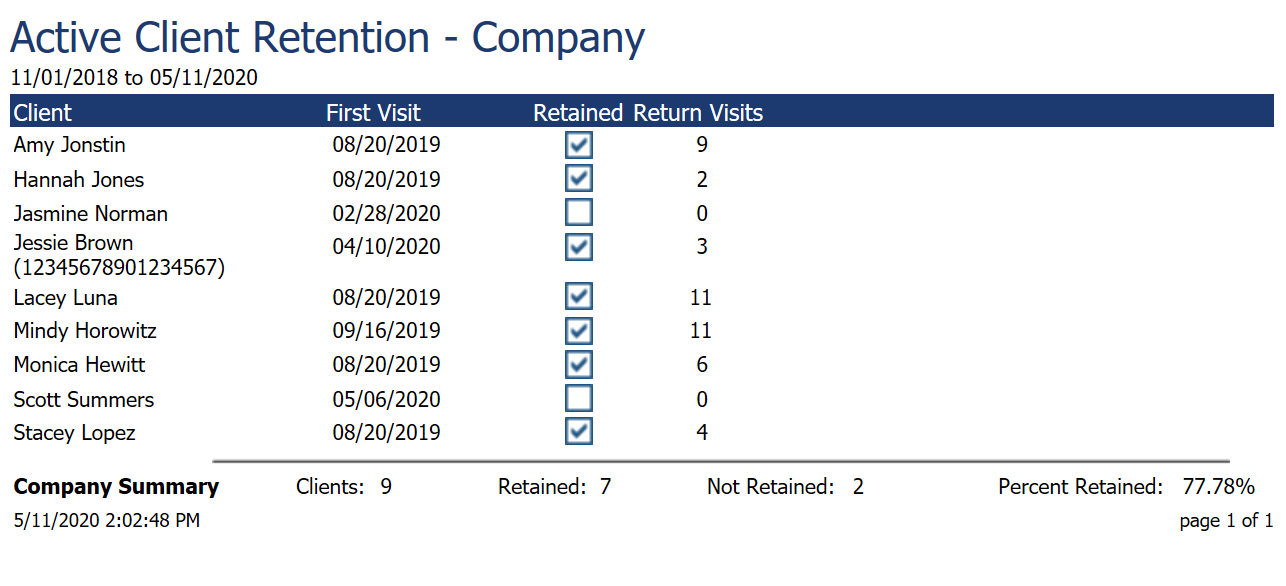
Detail
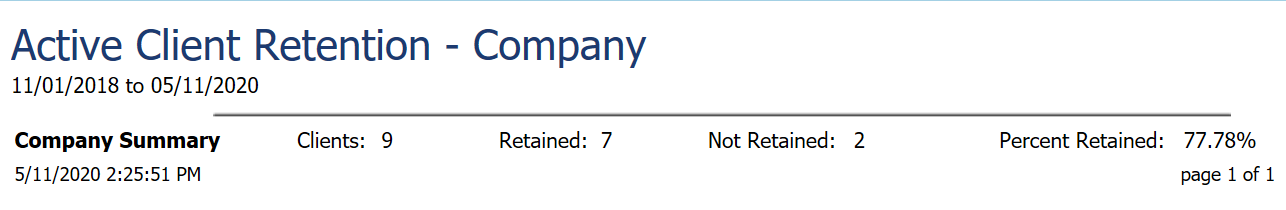
Summary
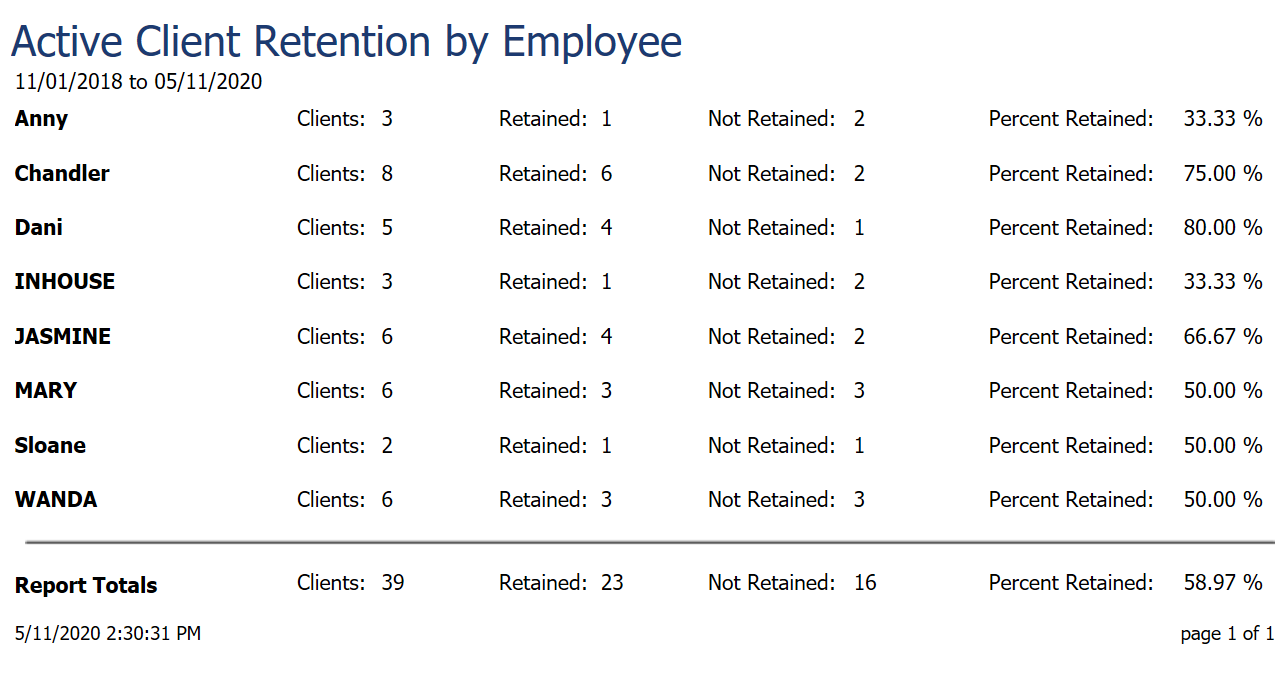
Retention - Active Clients by Employee
The Active Retention by Employee report shows your employees' client retention data. This report can be used to see which employees have built up customer loyalty with clients and how your whole team is keeping clients coming back!
Options Include:
- Detail or Summary
- Visit Date Range Selection
- All or Single Employee
- Team Selection (Ultimate Only)
- Employee Department Range
- Additional Options
- Sort By Options
This report displays the following information:
- Employee ID
- Client Name
- Visit Date
- Retained (Yes/No)
- Number of Return Visits
- Mobile Phone
- Numbers of Clients, Retained & Not (Both)
- Percent Retained (Both)
Important Note for Retention Reports:
- It is common for business totals to not match employee totals when it comes to retention.
The reason for that is this:
A new client comes in and sees 2 different providers. Each provider gets credit for this new client since this client is new to each employee. For the business as a whole, this is just one client.
That means that when you add up each individual employee totals that this client will count twice. When you look at the business report this client will only count once since, from the business's point of view, it is just one client.
Retained clients work the same way. If a client comes in to see one provider and then comes again a week later for a different provider then neither employee gets credit for retention since neither one really retained the client (at least not yet).
From the business’s point of view, the client is retained since it was a new client who came back.
Report Example:
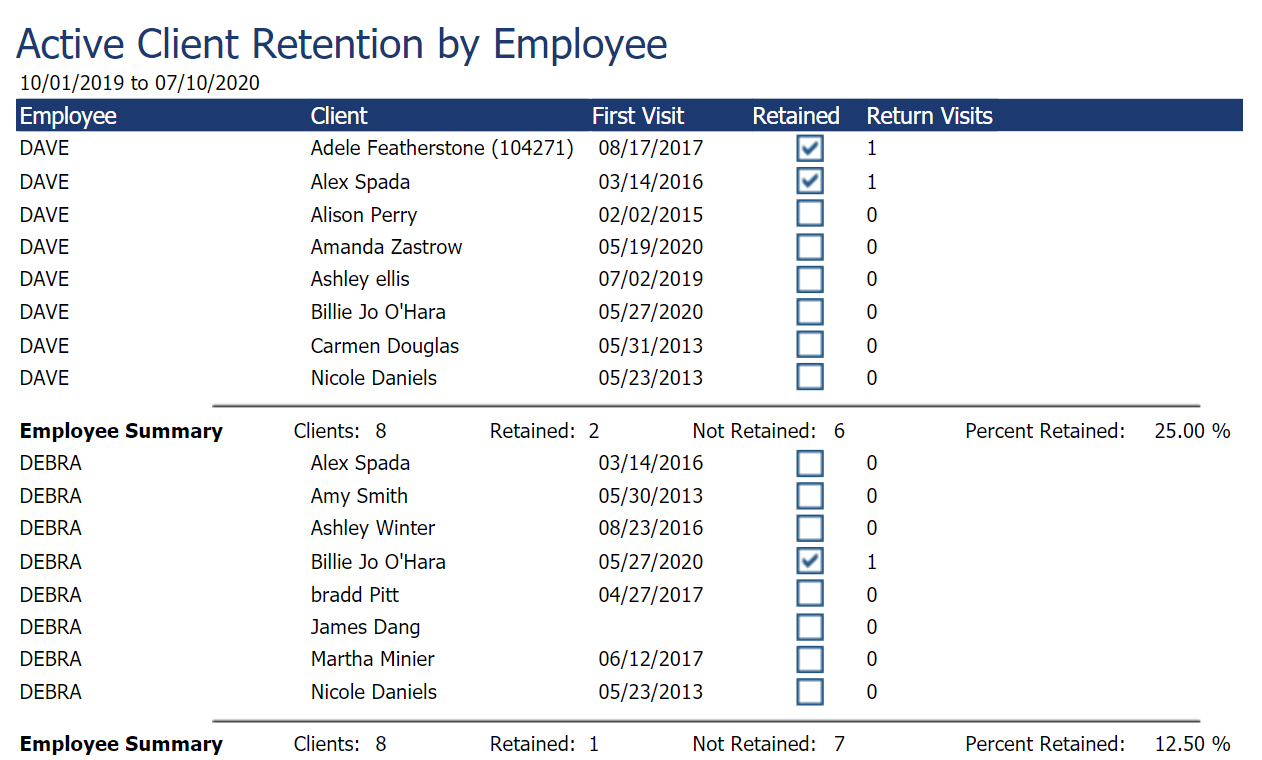
Detail
Summary
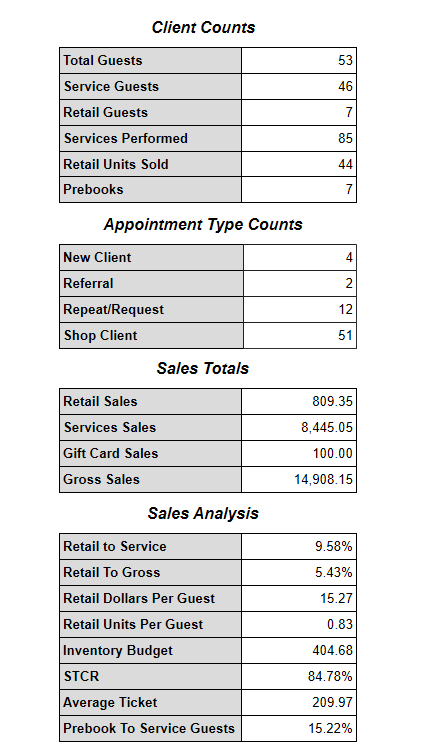
Business Analysis Summary Report
The Business Analysis Summary report is available with the Preferred & Ultimate editions of Envision. To upgrade, please contact our Sales Team at 800.231.9445 or sales@ennoview.com.
The Business Analysis Summary report gives you a quick snapshot of your business's performance! This report turns the actions you perform in Envision into an easy to understand spreadsheet detailing your company's stats.
Options Include:
- Date Range Selection
- All or Single Employee
- Team Selection (Ultimate Only)
- All or Single Employee Department
- All or Single Employee Type
- All or Single Goal Plan Selection
- Company Selection (For multi-location businesses)
This report displays the following information:
- Client Counts
- Appointment Type Counts
- Sales Totals
- Sales Analysis Information
Important Notes:
- Service Guests is equal to the number of clients who purchased just services or services and retail products.
- Retail Guests are clients who only purchased retail items.
- The New Clients, Salon Clients, Repeat/Requests, and Referrals will not be equal to Service Guests if clients have multiple services by a single employee on the same ticket.
- Service Sales include returns.
- RTS (Retail to Service) is calculated by Retail Sales / Service Sales.
- RTG (Retail to Gross) is calculated by Retail Sales / Gross Sales.
- Inventory Budget is calculated by Retail Sales / 2.
- STCR (Service to Client Ratio) is calculated by (# Services Performed - # of Service Guests) / # of Service Guests.
- The Gross Sales amount includes memberships and Other items sold.
Report Example:
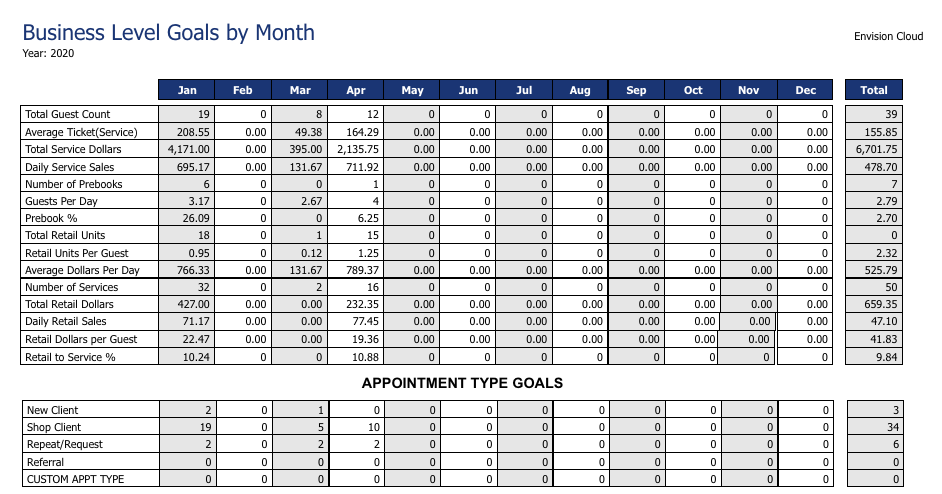
Business Goals By Month Report
The Business Goals By Month report is available with the Preferred & Ultimate editions of Envision. To upgrade, please contact our Sales Team at 800.231.9445 or sales@ennoview.com
The Business Goals by Month report compiles all data from assigned Employee Goal Plans into one spreadsheet which displays your company's overall performance. This all-encompassing report allows you to track the progress of your business over the year!
Options Include:
- Starting Month
- All or Single Employee
- All or Single Employee Department
This report displays the following information:
- General Goals
- Appointment Type Goals (provider)
- Service Type Goals (provider)
Report Example:
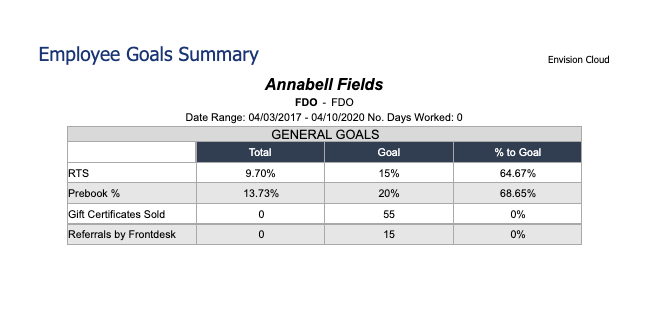
Employee Goal Summary Report
The Enhanced Employee Goal Summary report is available in the Preferred & Ultimate editions of Envision. To upgrade, please contact our Sales Team at 800.231.9445 or sales@ennoview.com.
The Employee Goal Summary report compares the goals of your employees to their current performance. With this report, you can easily track the progress of employees as they strive to accomplish their goals!
Options Include:
- Date Range Selection
- All or Single Goal Plan
- All or Single Employee
- Team Selection (Ultimate Only)
- All or Single Employee Department
- Active, Inactive, or All
- Company Selection (For multi-location businesses)
This report displays the following information:
- Total
- Goals
- % to Goal
- General Goals
- Guest Building (provider)
- Service Sales (provider)
- Retail Sales (provider)
Note:
- Service types without a goal level set will not show on the goal summary report.
- Services without a service type assigned will not count towards the goals set.
- Front Desk type goals include:
- Business RTS Percentage
- Business Prebook Percentage
Report Example:
Front Desk Operator Goals
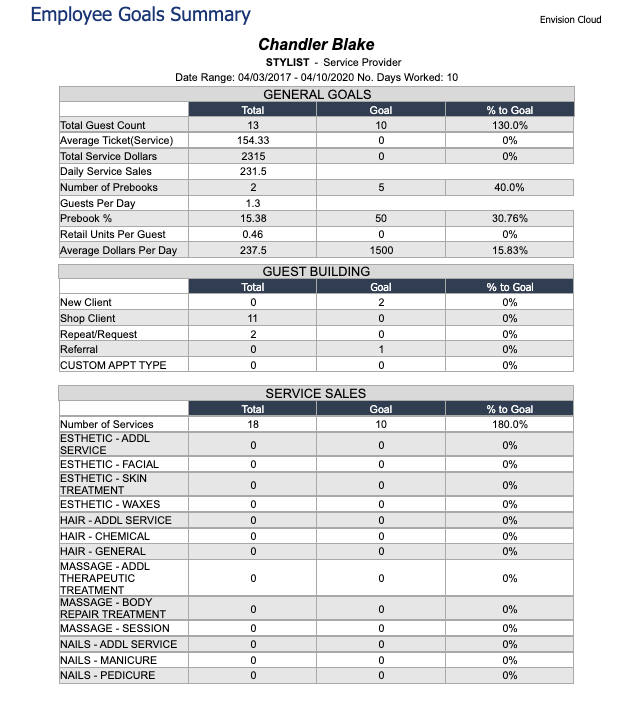
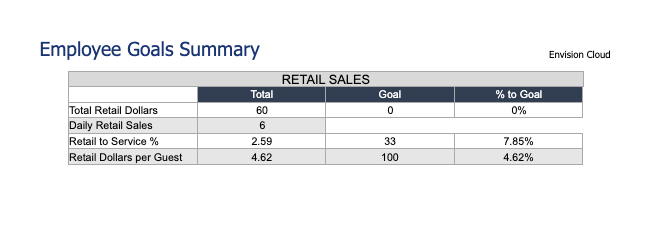
Service Provider Goals
Employee Goals by Month Report
The Employee Goals by Month Report is available in the Preferred & Ultimate editions of Envision. To upgrade, please contact our Sales Team at 800.231.9445 or sales@ennoview.com.
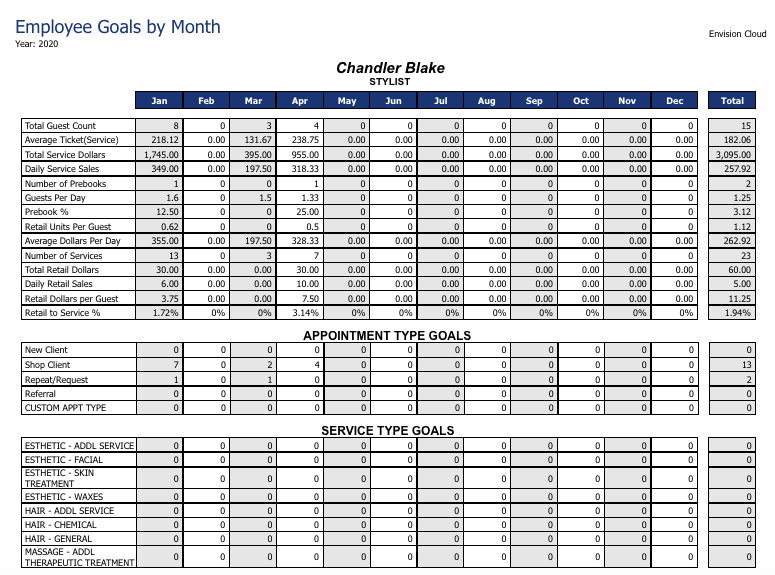
The Employee Goals by Month report displays data regarding your employee's goal on a monthly basis, allowing you to track and analyze their performance over a period of time. This report takes the work your service provider or front desk personnel has accomplished and shows their progress towards the Employee Goal Plans they are assigned to!
Options Include:
- Starting Month/Year
- All or Single Goal Plan
- All or Single Employee
- Team Selection (Ultimate Only)
- All or Single Employee Department
- Active, Inactive or All
This report displays the following information:
- General Goals
- Appointment Type Goals (provider)
- Service Type Goals (provider)
Report Example:
Employee Productivity Report
The Employee Productivity Report is available in the Preferred & Ultimate editions of Envision. To upgrade, please contact our Sales Team at 800.231.9445 or sales@ennoview.com.
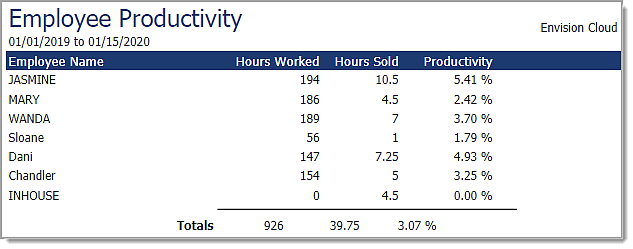
The Employee Productivity report shows the number of work hours and appointments sold, per employee. This report allows you to see how employees are utilizing their time and how productive they are during their workdays!
Options Include:
- Date Range Selection
- All or Single Employee
- Team Selection (Ultimate Only)
- All or Single Employee Department
- Active, Inactive, or All
- Use Clocked In Hours Instead of Work Schedule
- Sort By Options
- Company Selection (For multi-location businesses)
This report displays the following information:
- Employee ID
- Hours Worked
- Hours Sold
- Productivity Percentage
Important Notes:
- The hours sold number comes from the standard length of time for services sold in the sales register for each employee. This report does not refer to the appointment calendar.
- The number of hours worked comes from the Employee Work Schedule, unless the option to use the time clock hours is selected.
Report Example:
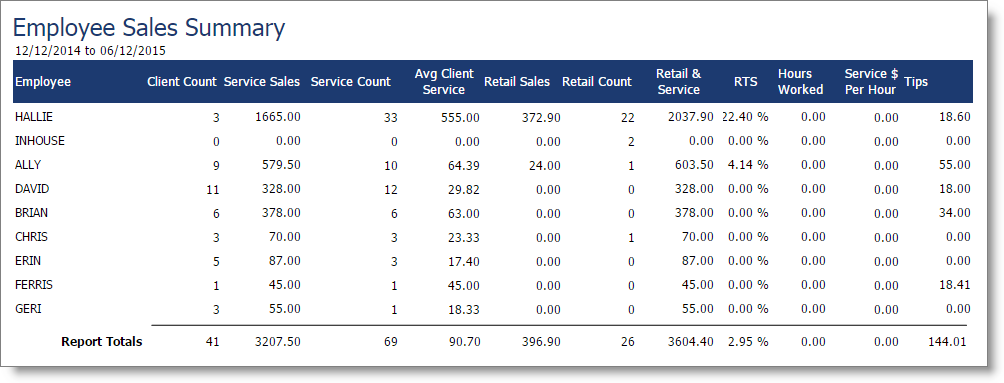
Employee Sales Summary Report
This report shows in-depth information about sales, services performed, and clocked hours, per employee. This report can help you to gauge how successfully employees are selling retail or performing services!
Options Include:
- Date Range Selection
- All or Single Employee
- Team Selection (Ultimate Only)
- All or Single Employee Department
- Status Selection
- Company Selection (For multi-location businesses)
This report displays the following information:
- Employee ID
- Client Count
- Service Sales
- Service Count
- Average Client Service
- Retail Sales
- Retail Count
- Retail and Service Sales
- Retail to Service Percentage
- Hours Worked
- Service Dollars Per Hour
- Tips
Report Example:
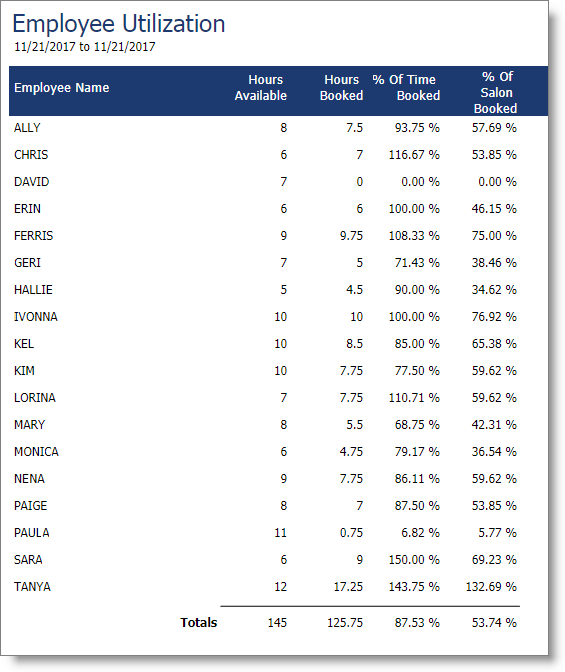
Employee Utilization Report
The Employee Utilization Report is available in the Preferred & Ultimate editions of Envision. To upgrade, please contact our Sales Team at 800.231.9445 or sales@ennoview.com.
The Employee Utilization report shows the amount and percentage of time booked, per employee. With this report, you can see which services providers in your business are booked more consistently! You can also see if your business is overbooked often, which can help you in future hiring decisions and work schedule creation.
Options Include:
- Date Range Selection
- All or Single Employee
- Team Selection (Ultimate Only)
- All or Single Employee Department
- Active, Inactive, or All
- Include Employee Block Times
- Sort By Options
- Company Selection (For multi-location businesses)
This report displays the following information:
- Employee ID
- Hours Available
- Hours Booked
- Percent of Time Booked
- Percent of Salon Booked
Important Note:
- The number of hours booked comes from the booked times on the appointment calendar.
- The number of hours available comes from the Employee Work Schedule.
Report Example:
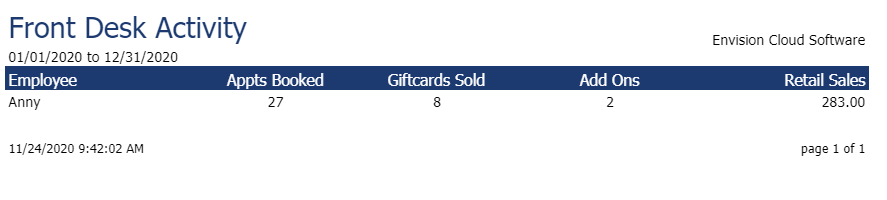
Front Desk Activity Report (Ultimate ONLY)
The Front Desk Activity Report tracks the activities of employees whose goal type is set to Front Desk Operator. This report can be used to gauge employee performance and productivity.
Options Include:
- Date Range Selection
- All or Single Employee
- Team Selection
- Sort By Options
This report displays the following information:
- Employee
- Appointments Booked
- Gift cards sold
- Add ons
- Retail Sales
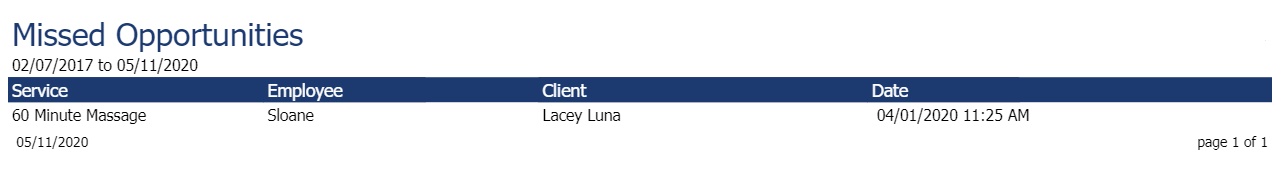
Missed Opportunities Report
The Missed Opportunity Report is available in the Ultimate edition of Envision. To upgrade, please contact our Sales Team at 800.231.9445 or sales@ennoview.com.
The Missed Opportunity Report displays data regarding missed opportunities logged into the Appointment Schedule. A missed opportunity is when a client attempts to make an appointment, but you're completely booked or don't have the resources available and the client is unable to choose a different time, meaning you would miss out on booking them this time around. This is a great tool to analyze which services and employees are in high demand. This feature can aid your business in decision-making regarding hiring, scheduling, and more!
Options Include:
- Date Range Selection
- All or Single Employee
- Team Selection (Ultimate Only)
- All or Single Service
This report displays the following information:
- Service
- Employee
- Client
- Date & Time
Report Example:
Retention - New Clients
The New Client Retention report shows business retention information about clients who first visited your business in the selected date range. With this report, you can see how effectively your business keeps new clients!
Options Include:
- Detail or Summary
- First Visit Date Range Selection
- Additional Options
- Sort By Options
This report displays the following information:
- Client Name
- First Visit Date
- Retained (Yes/No)
- Number of Return Visits
- Home Phone
- Mobile Phone
- Numbers of Clients, Retained & Not (Both)
- Percent Retained (Both)
Important Note for Retention Reports:
- It is common for business totals to not match employee totals when it comes to retention.
The reason for that is this:
A new client comes in and sees 2 different providers. Each provider gets credit for this new client since this client is new to each employee. For the business as a whole, this is just one client.
That means that when you add up each individual employee totals that this client will count twice. When you look at the business report this client will only count once since, from the business's point of view, it is just one client.
Retained clients work the same way. If a client comes in to see one provider and then comes again a week later for a different provider then neither employee gets credit for retention since neither one really retained the client (at least not yet).
From the business’s point of view, the client is retained since it was a new client who came back.
Report Example:
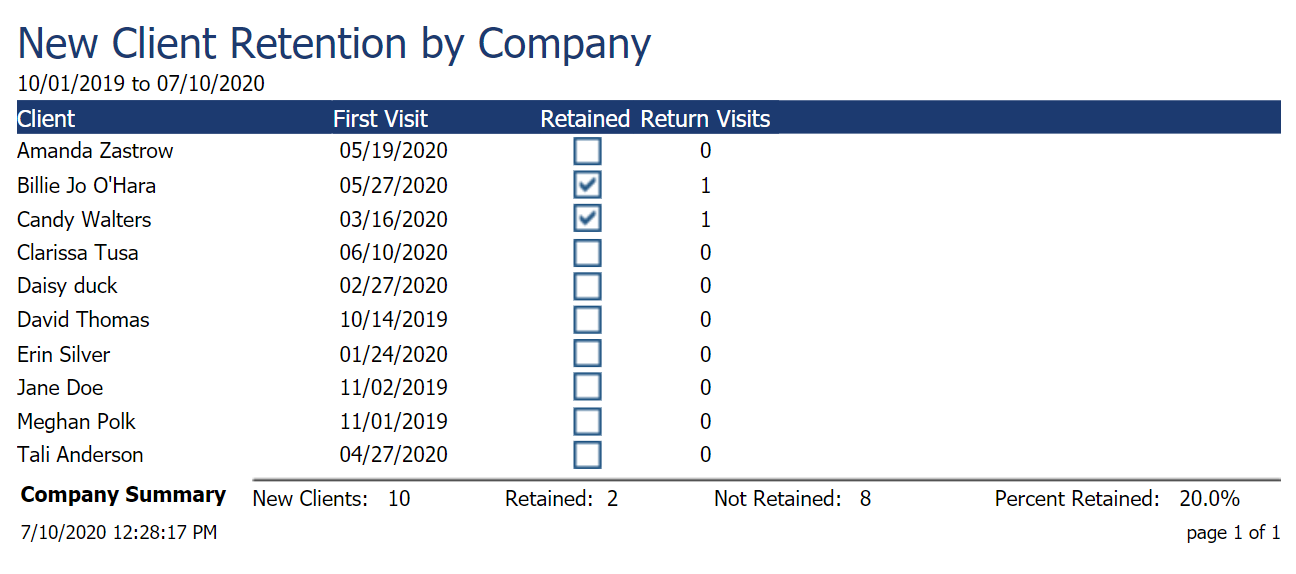
Detail
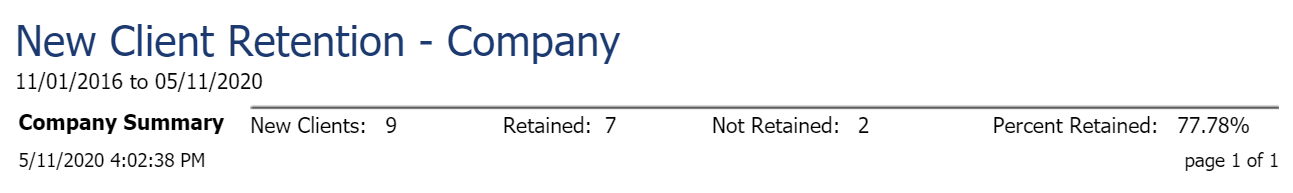
Summary
Retention - New Clients by Employee
This report shows business retention information about clients who first visited the employee in the selected date range. Please bear in mind that this report can include long-time customers who first visited the employee in the chosen date range. This will set them as 'new' to the employee.
Options Include:
- Detail or Summary
- Initial Visit Date Range Selection
- All or Single Employee
- Team Selection (Ultimate Only)
- Employee Department Range
- Active, Inactive, All
- Additional Options
- Sort By Options
This report displays the following information:
- Employee ID
- Client Name
- First Visit Date
- Retained (Yes/No)
- Number of Return Visits
- Mobile Phone
- Numbers of Clients, Retained & Not (Both)
- Percent Retained (Both)
Important Note for Retention Reports:
- It is common for business totals to not match employee totals when it comes to retention.
The reason for that is this:
A new client comes in and sees 2 different providers. Each provider gets credit for this new client since this client is new to each employee. For the business as a whole this is just one client.
That means that when you add up each individual employee totals that this client will count twice. When you look at the business report this client will only count once since, from the business's point of view, it is just one client.
Retained clients work the same way. If a client comes in to see one provider and then comes again a week later for a different provider then neither employee gets credit for retention since neither one really retained the client (at least not yet).
From the business’s point of view the client is retained since it was a new client who came back.
Report Example:
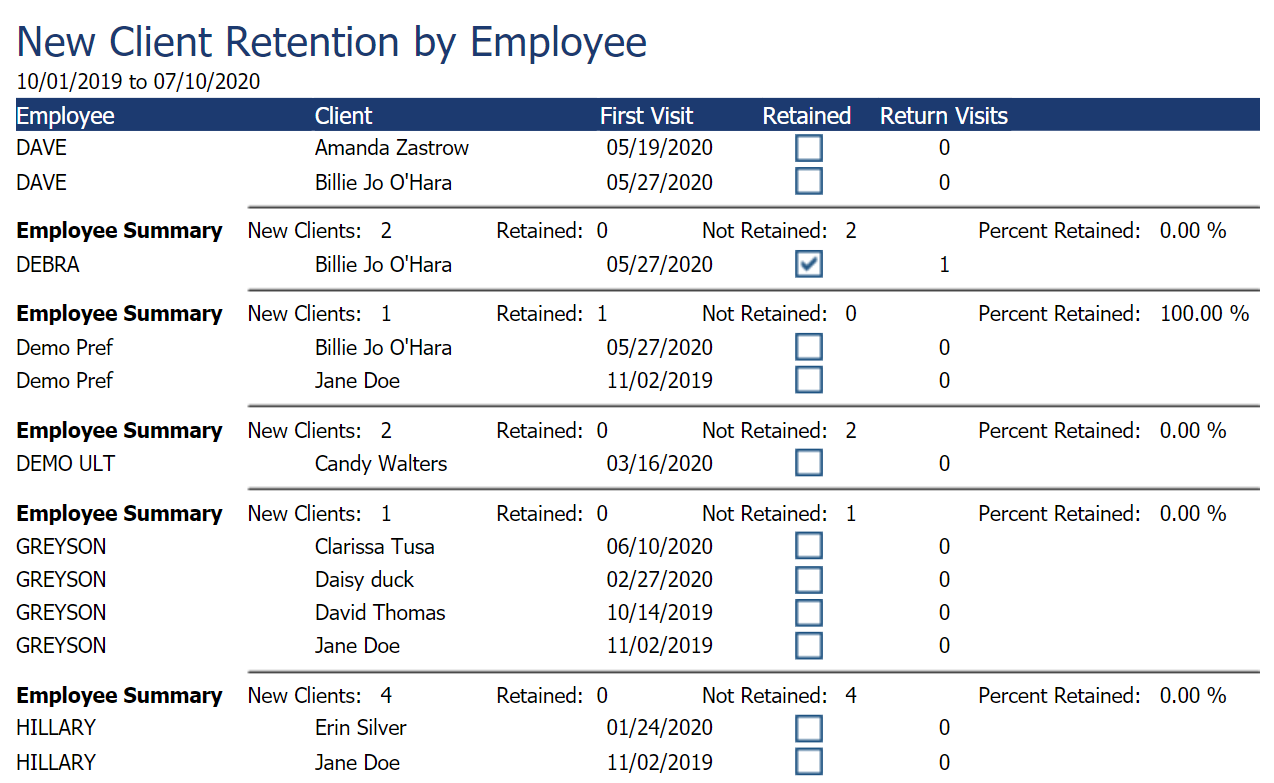
Detail
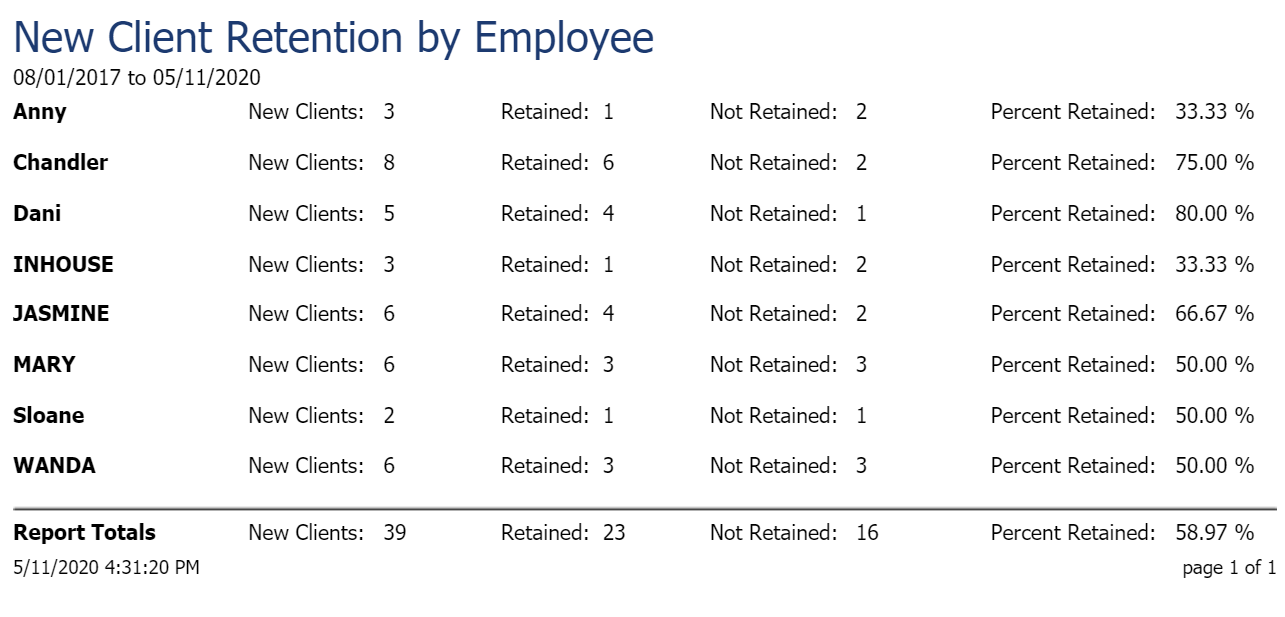
Summary
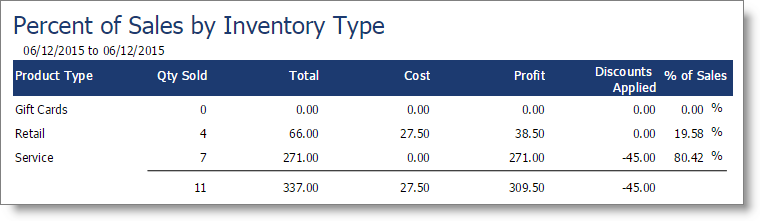
Percent of Sales by Item Type Report
The Percent of Sales by Item Type report shows detailed information about the sales of each product type! With this report, you can determine the most profitable type of inventory within your business.
Options Include:
- Date Range Selection
- Company Selection (For multi-location businesses)
This report displays the following information:
- Product Type
- Quantity Sold
- Total
- Cost
- Profit
- Discounts Applied
- Percent of Sales
Report Example:
Prebook Analysis Report
This report shows information about appointments booked before the client's sale is completed! In the Sales Register, the cashier has the option to book a client's future appointment before cashing out. Prebooking is a great tool for client retention, and this report can help you track how often your clients are prebooking!
Options Include:
- Detail or Summary
- Date Range Selection
- All or Single Employee
- All or Single Employee Department
- All or Single Client
- Other Options: Include Retail Only Guests/Subtotal by Employee Department
- Sort By Options
This report displays the following information:
- Employee ID (Both)
- Client Name
- Ticket #
- Ticket Date & Time
- Prebooked? (Yes/No)
- Prebook Date & Time
- Prebooked Service
- Employee Prebook Count (Both)
- Guest Count (Both)
- Prebook Percentage (Both)
- Company Totals (Both)
Report Example:
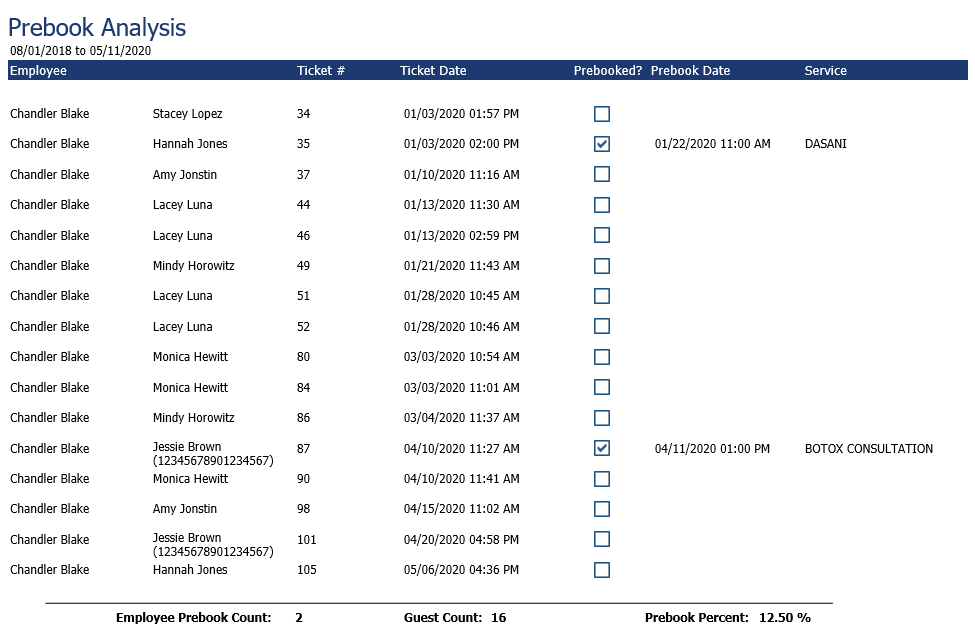
Detail
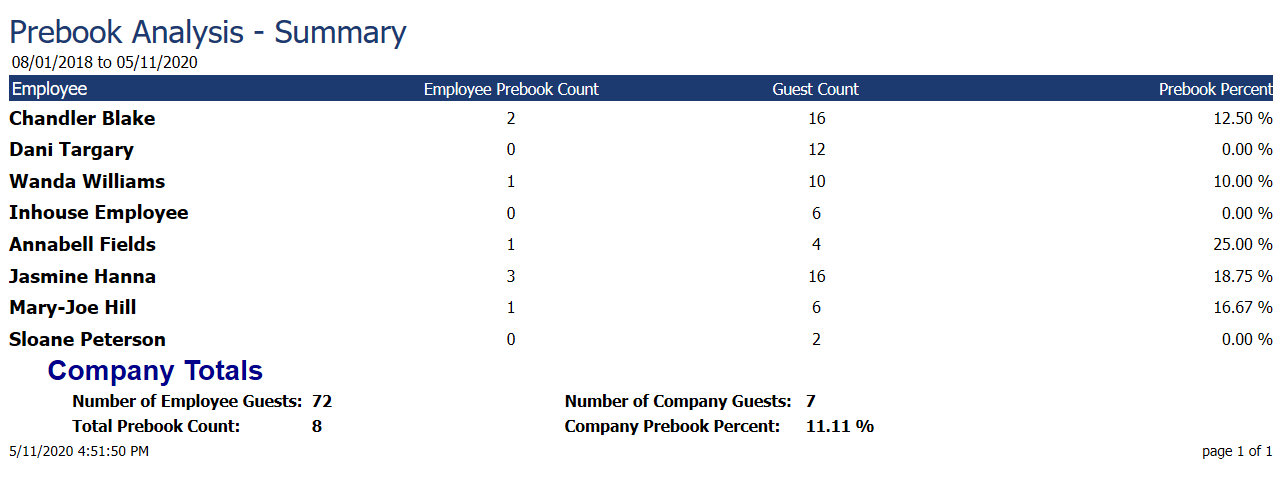
Summary
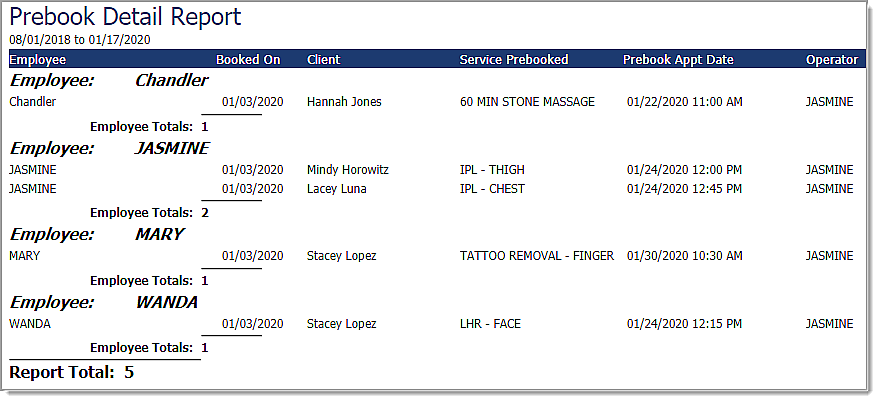
Prebook Detail Report
The Prebook Detail report shows information about appointments booked before the client's sale is completed. Prebooks may be set to include appointments booked after the client has been cashed out. With this report, you can get a more detailed view of each prebook!
Options Include:
- Date Range Selection
- All or Single Employee
- Team Selection (Ultimate Only)
- Employee Department Range
- All or Single Client
- All or Single Operator
- Sort By Options
This report displays the following information:
- Employee ID
- Appointment Booked On Date
- Client Name
- Service Prebooked
- Prebooked Appointment Date
- Operator
Report Example:
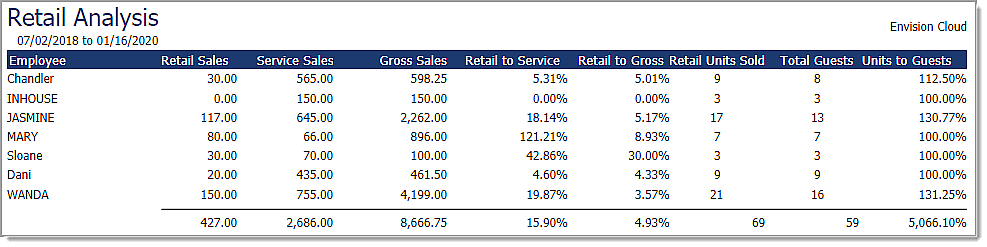
Retail Analysis Report
The Retail Analysis report shows information about the retail and service sales per employee for the business. This gives you valuable information about how your business is selling retail items and services! This can be used to gauge how effectively your business is adding on retail items.
Options Include:
- Date Range Selection
- All or Single Employee
- Team Selection (Ultimate Only)
- Employee Department Range
- Include or Exclude Returns
- Sort By Options
- Company Selection (For multi-location businesses)
This report displays the following information:
- Employee ID
- Retail Sales
- Service Sales
- Gross Sales
- Retail to Service Percentage
- Retail to Gross Percentage
- Retail Units Sold
- Total Guests
- Units to Guests
Report Example:
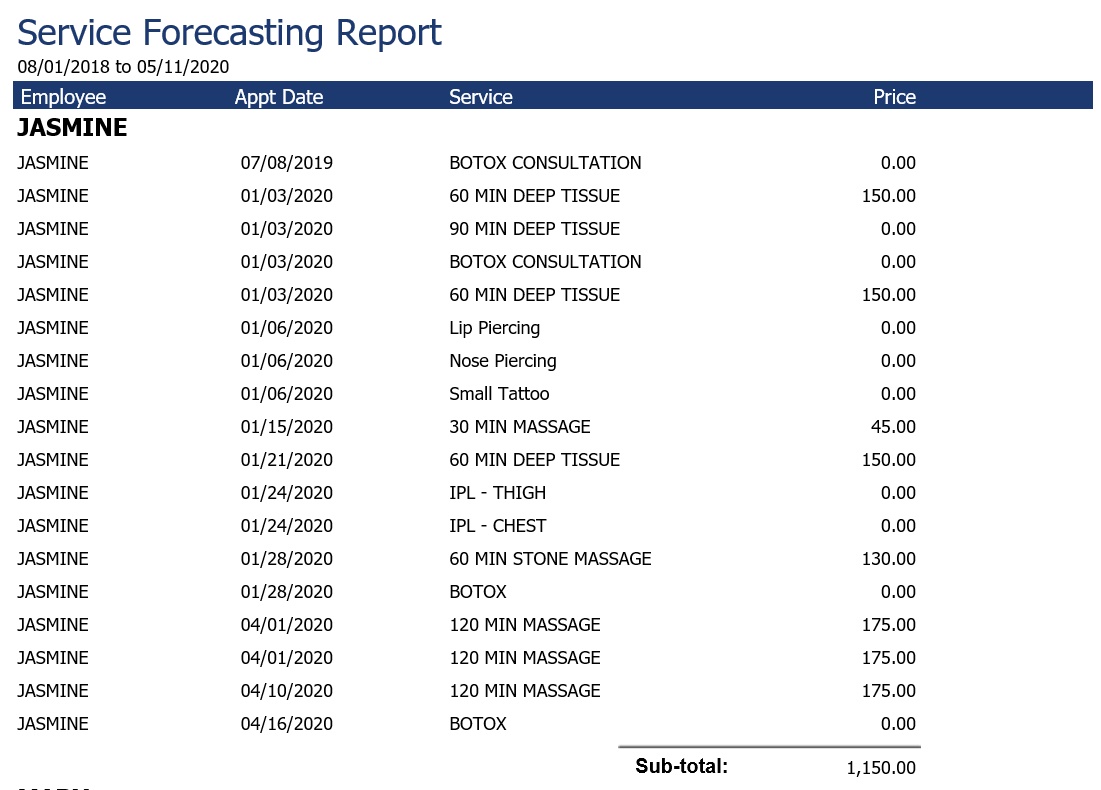
Service Forecast Report
This report is available in the Preferred & Ultimate editions of Envision. To upgrade, please contact our Sales Team at 800.231.9445 or sales@ennoview.com.
The Service Forecast report shows information on upcoming services scheduled to be performed. This report can be used to predict what an employee can expect for an upcoming week!
Options Include:
- Date Range Selection
- All or Single Employee
- Team Selection (Ultimate Only)
- All or Single Employee Department
- All or Single Inventory Department
- Sort By Options
- Group By Options
- Company Selection (For multi-location businesses)
This report displays the following information:
- Employee ID
- Appointment Date
- Appointment Service
- Appointment Price
Report Example:
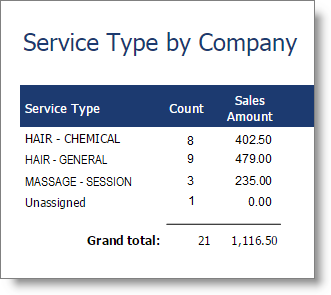
Service Types by Company Report
The Service Types by Company report shows information on the service type entered on services performed. This report allows you to see the most popular and profitable service types within your business!
Options Include:
- Date Range Selection
- All or Single Employee
- Team Selection (Ultimate Only)
- All or Single Employee Department
- Company Selection (For multi-location businesses)
This report displays the following information:
- Service Type
- Count
- Sales Amount
Report Example:
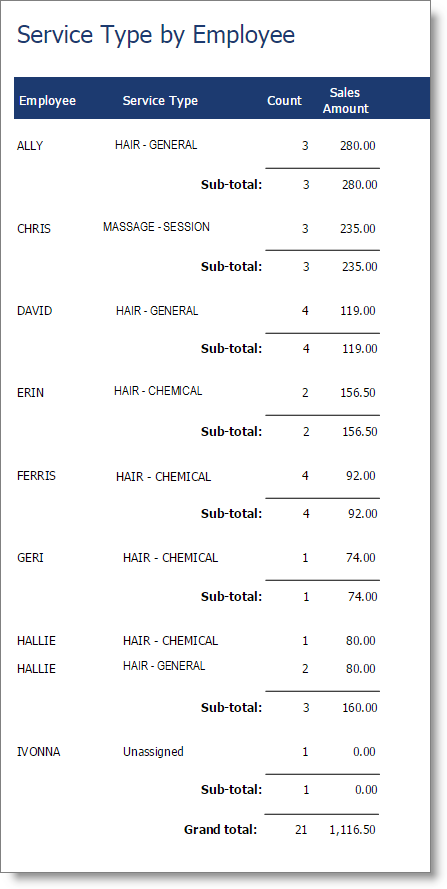
Service Types by Employee Report
The Service Types by Employee report displays the different service types performed by employees! This report can be used to view how many services an employee has completed over a period of time.
Options Include:
- Detail or Summary
- Date Range Selection
- All or Single Employee
- Team Selection (Ultimate Only)
- All or Single Employee Department
- Company Selection (For multi-location businesses)
- Sort By Options
This report displays the following information:
- Employee ID
- Service Type
- Count
- Sales Amount
Report Example:
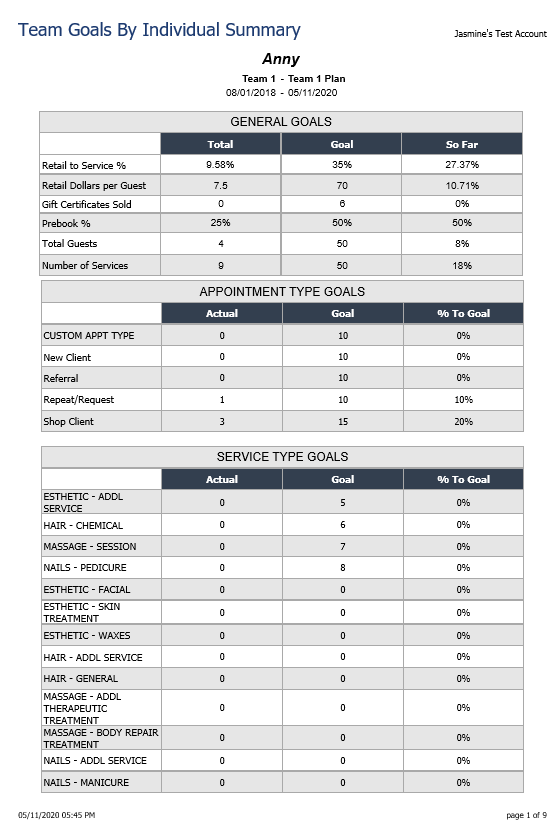
Team Goals by Individual Summary Report
Employee Teams and Team Goals included in the Ultimate edition of Envision. To upgrade, please contact our Sales Team at 800.231.9445 or sales@ennoview.com.
The Team Goals by Individual Summary report displays information on the goals entered for employees within teams that have team goals applied. The "So Far" column in this report is especially helpful as it allows employees to track their progress towards accomplishing their team goal!
Options Include:
- Date Range Selection
- All or Single Team
- All or Single Goal Plan
- All or Single Employee
- Company Selection (For multi-location businesses)
This report displays the following information:
- General Goals
- Appointment Type Goals (provider)
- Service Type Goals (provider)
- Total/Actual
- Goal
- So Far/% To Goal
Note:
- Service types without a goal level set will not show on the goal summary report.
- Services without a service type assigned will not count towards the goals set.
- Front Desk type goals include:
- Business RTS Percentage
- Business Prebook Percentage
Report Example:
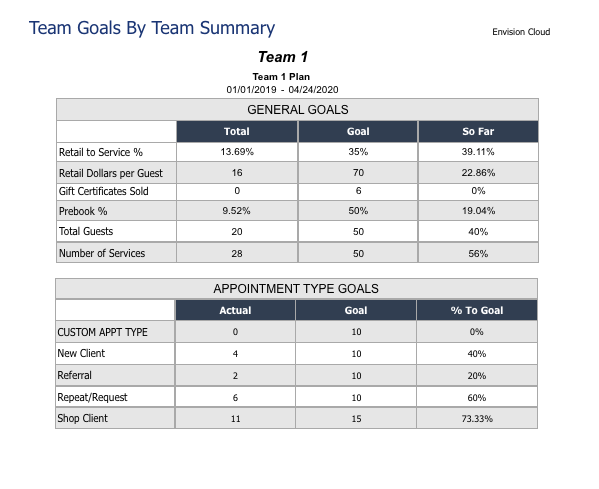
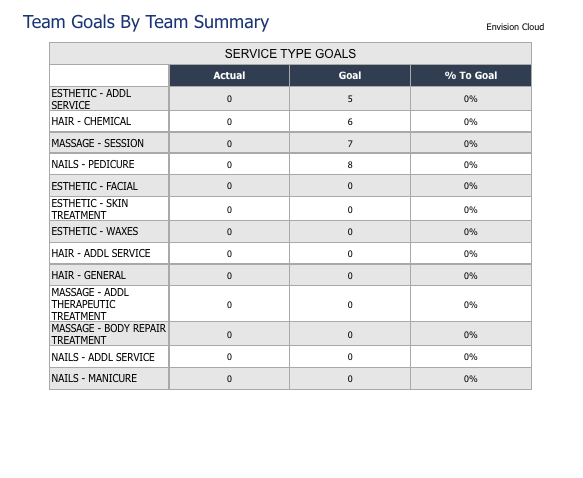
Team Goals by Team Summary Report
Employee Teams and Team Goals included in the Ultimate edition of Envision. To upgrade, please contact our Sales Team at 800.231.9445 or sales@ennoview.com.
The Team Goals by Team Summary report shows the progress teams have made towards their set team goals. The "So Far" column in this report is especially helpful for employees to track their team's progress towards accomplishing their goal!
Options Include:
- Date Range Selection
- All or Single Team
- All or Single Goal Plan
- Company Selection (For multi-location businesses)
This report displays the following information:
- General Goals
- Appointment Type Goals (provider)
- Service Type Goals (provider)
- Total/Actual
- Goal
- So Far/% To Goal
Report Example:
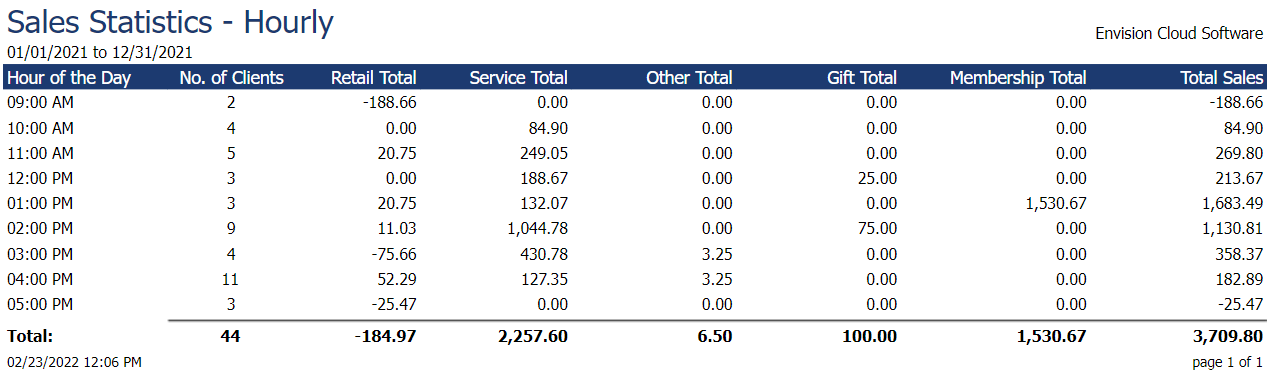
Sales Statistics - Hourly Report
The report gathers all the sales and allocates them by the hour they occurred. For example if the user wanted to know the most productive hours on January, then they would select the date range for January and run the report. The report would break up the sales by hour in a 24 hour day. They could find out that the hours with the most sales are 1 to 4 pm.
Report Example:
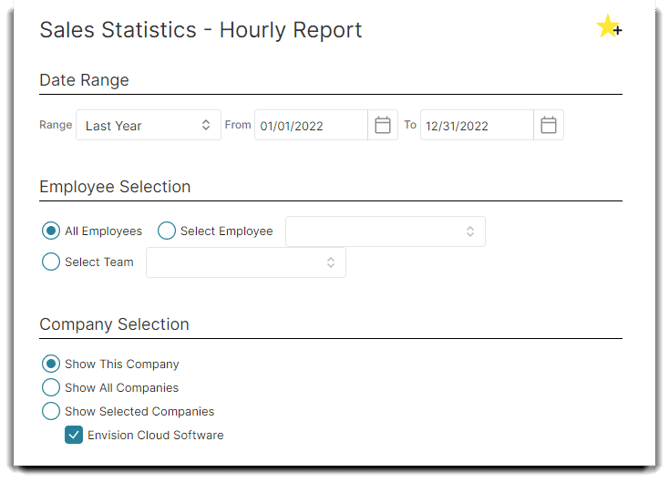
Example of Preview:
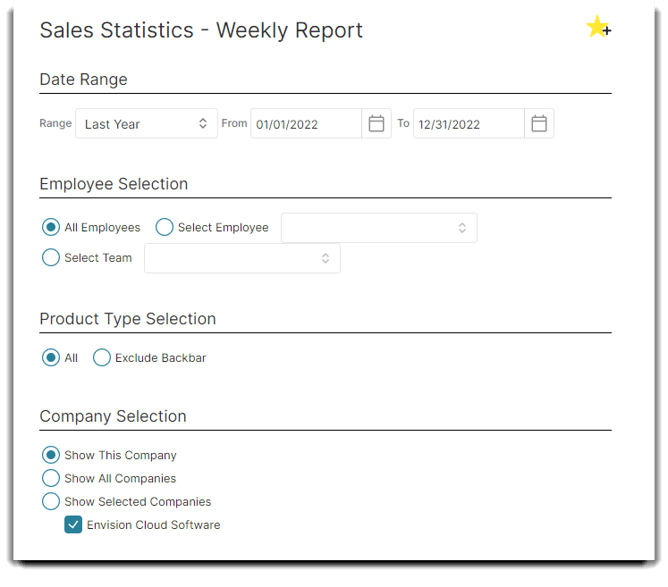
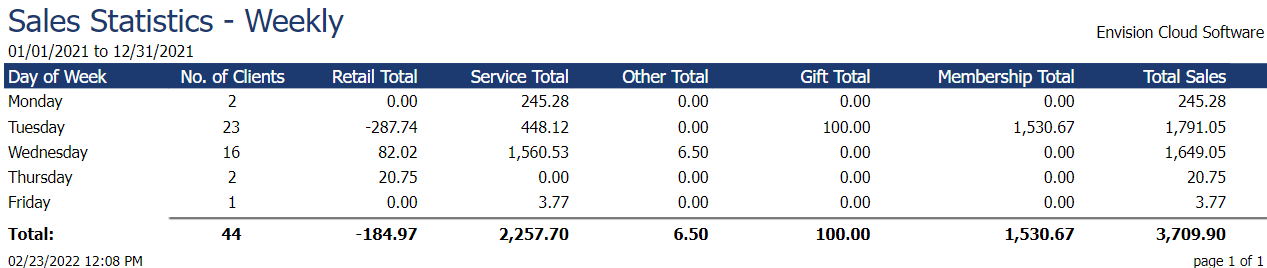
Sales Statistics - Weekly Report
The report gathers all the sales and allocates them by the by day of week (Sunday to Saturday) they occurred. For example if the user wanted to know the most productive days in January, then they would select the date range for January and run the report. The report would break up the sales by days. They could find out that the days with the most sales are Tuesdays.
Report Example:
Preview:
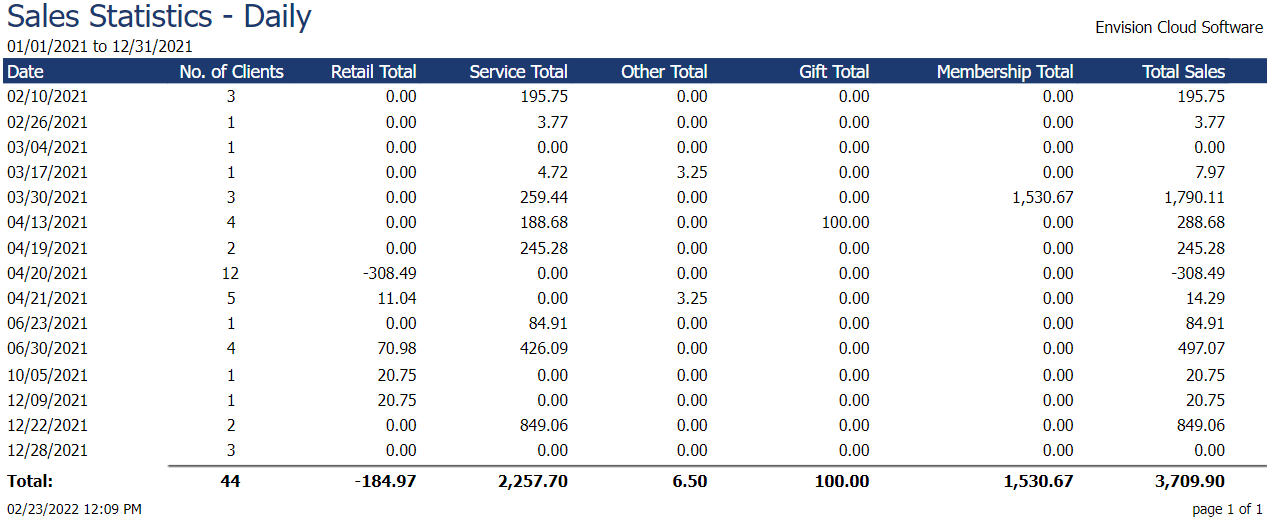
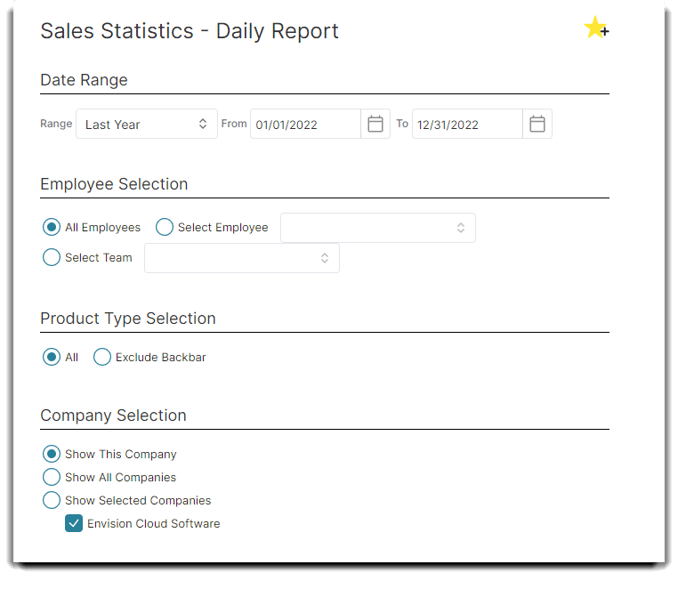
Sales Statistics - Daily Report
The report gathers all the sales and allocates them by the day they occurred.
Report Example:
Preview: