Learn about different Sales Growth Reports
Sales Growth Reports
Click on the links to jump to a report!
Sales by Employee Department Growth Report
Sales by Employee Growth Report
Sales by Gift Card Growth Report
Sales by Inventory Class Growth Report
Sales by Inventory Department Growth Report
Sales by Inventory Growth Report
Sales by Lead Source Growth Report
Sales by Manufacturer Growth Report
Sales by Service Growth Report
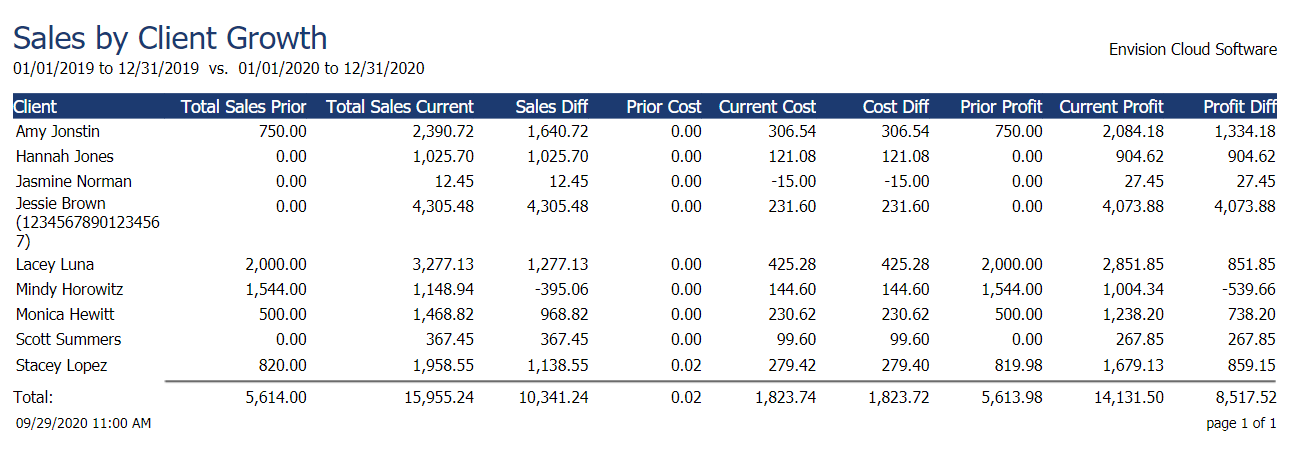
Sales by Client Growth Report
The Sales by Client Growth Report compares client sales, costs, and profits from different periods of time. This allows your business to see shifts in client purchasing over time and how that impacts profit.
Options Include:
- Date Ranges
- Graph Options
- Inventory Type
- All or Single Client
- All or Single Lead Source
- All or Single Employee
- Team Selection (Ultimate Only)
- All or Single Employee Department
- All or Single Item
- All or Single Inventory Department
- All or Single Inventory Class
- All or Single Vendor
- All or Single Manufacturer
- Sort By Options
- Company Selection (For multi-location businesses)
This report displays the following information:
- Client
- Total Sales Prior
- Total Sales Current
- Sales Difference
- Prior Cost
- Current Cost
- Cost Difference
- Prior Profit
- Current Profit
- Profit Difference
Report Example:
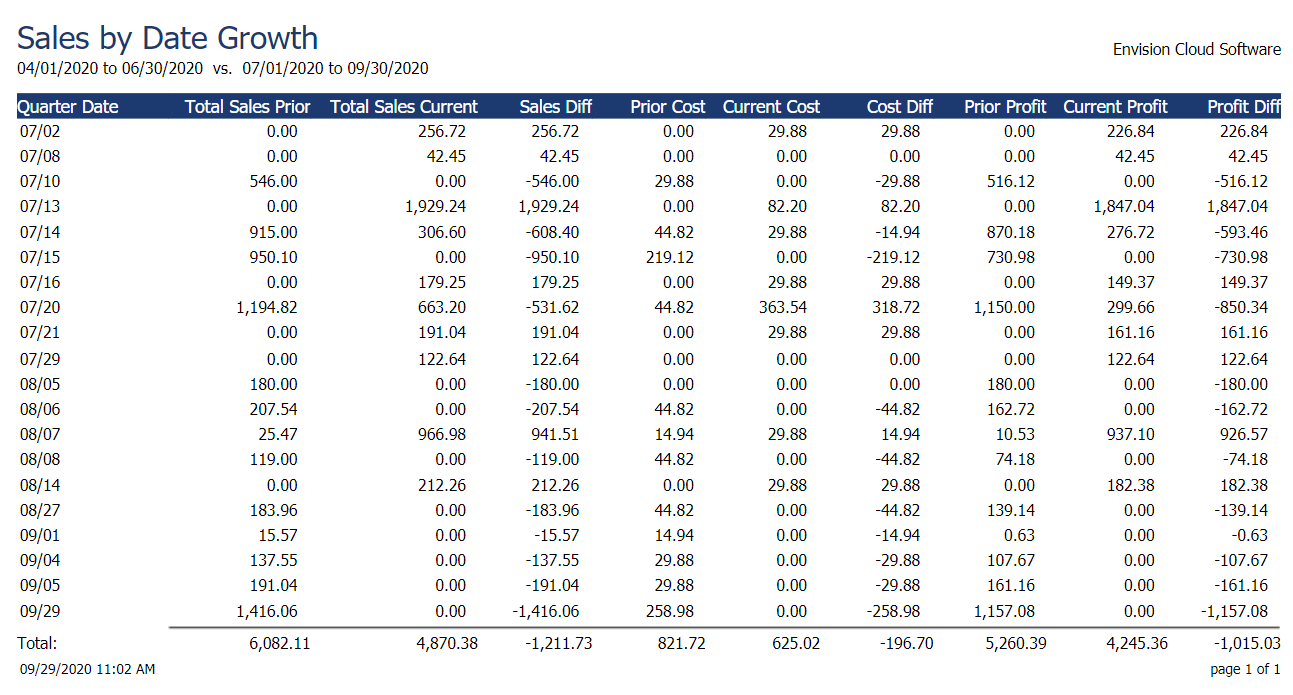
Sales by Date Growth Report
The Sales by Date Growth Report compares your business's sales, costs, and profits, day-by-by. Based on the example below, the first row is 04/01/2020 compared to 12/03/2018 as they're both the first dates of the ranges selected for the report.
Options Include:
- Date Ranges
- Graph Options
- Inventory Type
- All or Single Client
- All or Single Lead Source
- All or Single Employee
- Team Selection (Ultimate Only)
- All or Single Employee Department
- All or Single Item
- All or Single Inventory Department
- All or Single Inventory Class
- All or Single Vendor
- All or Single Manufacturer
- Sort By Options
- Company Selection (For multi-location businesses)
This report displays the following information:
- Total Sales Prior
- Total Sales Current
- Sales Difference
- Prior Cost
- Current Cost
- Cost Difference
- Prior Profit
- Current Profit
- Profit Difference
Report Example:
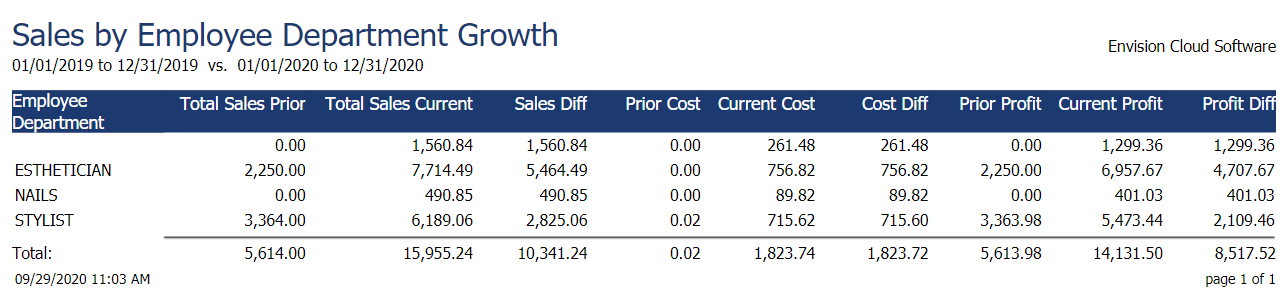
Sales by Employee Department Growth Report
The Sales by Employee Department Growth Report compares the sales, costs, and profits of employee departments from different periods of time. This allows your business to see shifts in employee department performance over time and how that influences profit.
Options Include:
- Date Ranges
- Graph Options
- Inventory Type
- All or Single Client
- All or Single Lead Source
- All or Single Employee
- Team Selection (Ultimate Only)
- All or Single Employee Department
- All or Single Item
- All or Single Inventory Department
- All or Single Inventory Class
- All or Single Vendor
- All or Single Manufacturer
- Sort By Options
- Company Selection (For multi-location businesses)
This report displays the following information:
- Employee Department
- Total Sales Prior
- Total Sales Current
- Sales Difference
- Prior Cost
- Current Cost
- Cost Difference
- Prior Profit
- Current Profit
- Profit Difference
Report Example:
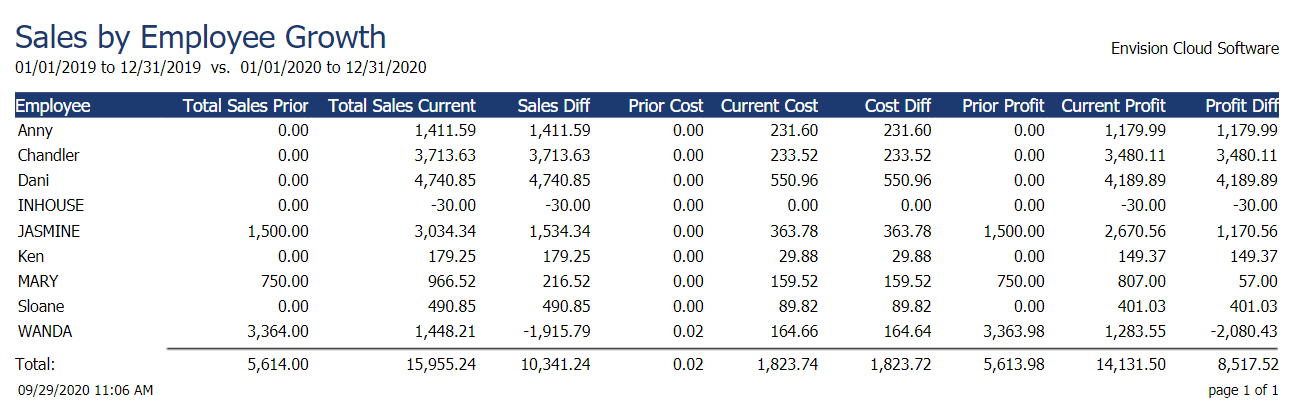
Sales by Employee Growth Report
The Sales by Employee Growth Report compares employee sales, costs, and profits from different periods of time. This allows your business to see shifts in employee performance over time and how that impacts profit.
Options Include:
- Date Ranges
- Graph Options
- Inventory Type
- All or Single Client
- All or Single Lead Source
- All or Single Employee
- Team Selection (Ultimate Only)
- All or Single Employee Department
- All or Single Item
- All or Single Inventory Department
- All or Single Inventory Class
- All or Single Vendor
- All or Single Manufacturer
- Sort By Options
- Company Selection (For multi-location businesses)
This report displays the following information:
- Employee
- Total Sales Prior
- Total Sales Current
- Sales Difference
- Prior Cost
- Current Cost
- Cost Difference
- Prior Profit
- Current Profit
- Profit Difference
Report Example:
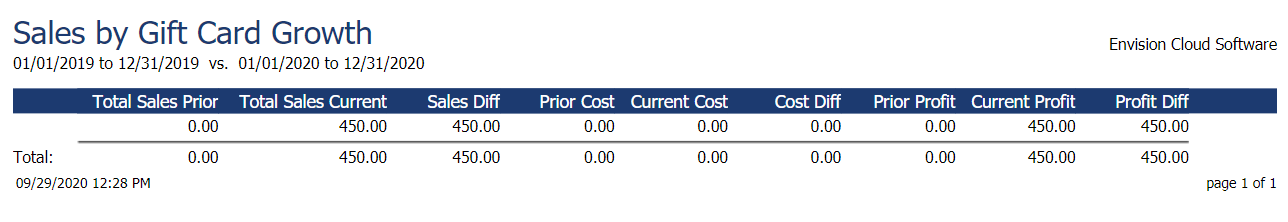
Sales by Gift Card Growth Report
The Sales by Gift Card Growth Report compares gift card sales, costs, and profits from two different periods of time. This allows your business to see changes in gift card purchasing and the differences in gift card profit.
Options Include:
- Date Ranges
- Graph Options
- Inventory Type
- All or Single Client
- All or Single Lead Source
- All or Single Employee
- Team Selection (Ultimate Only)
- All or Single Employee Department
- All or Single Item
- All or Single Inventory Department
- All or Single Inventory Class
- All or Single Vendor
- All or Single Manufacturer
- Sort By Options
- Company Selection (For multi-location businesses)
This report displays the following information:
- Total Sales Prior
- Total Sales Current
- Sales Difference
- Prior Cost
- Current Cost
- Cost Difference
- Prior Profit
- Current Profit
- Profit Difference
Report Example:
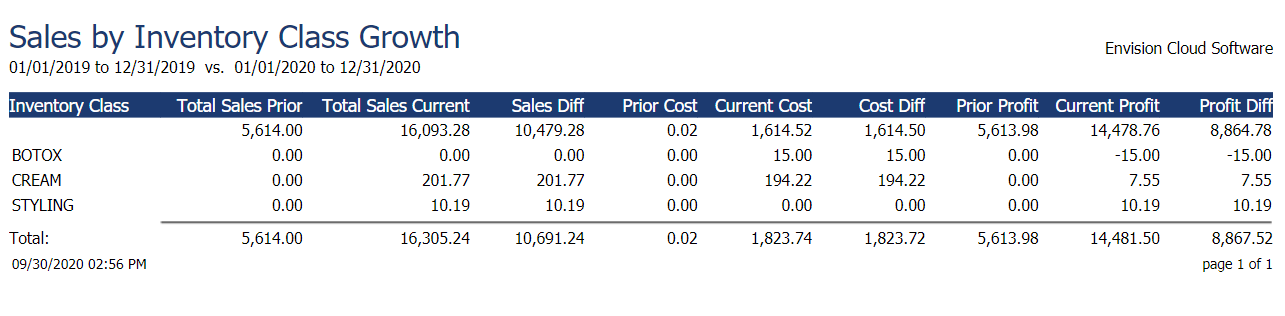
Sales by Inventory Class Growth Report
The Sales by Inventory Class Growth Report compares inventory class sales, costs, and profits from different periods of time. This allows your business to see the profitability of different inventory classes over time.
Options Include:
- Date Ranges
- Graph Options
- Inventory Type
- All or Single Client
- All or Single Lead Source
- All or Single Employee
- Team Selection (Ultimate Only)
- All or Single Employee Department
- All or Single Item
- All or Single Inventory Department
- All or Single Inventory Class
- All or Single Vendor
- All or Single Manufacturer
- Sort By Options
- Company Selection (For multi-location businesses)
This report displays the following information:
- Inventory Class
- Total Sales Prior
- Total Sales Current
- Sales Difference
- Prior Cost
- Current Cost
- Cost Difference
- Prior Profit
- Current Profit
- Profit Difference
Report Example:
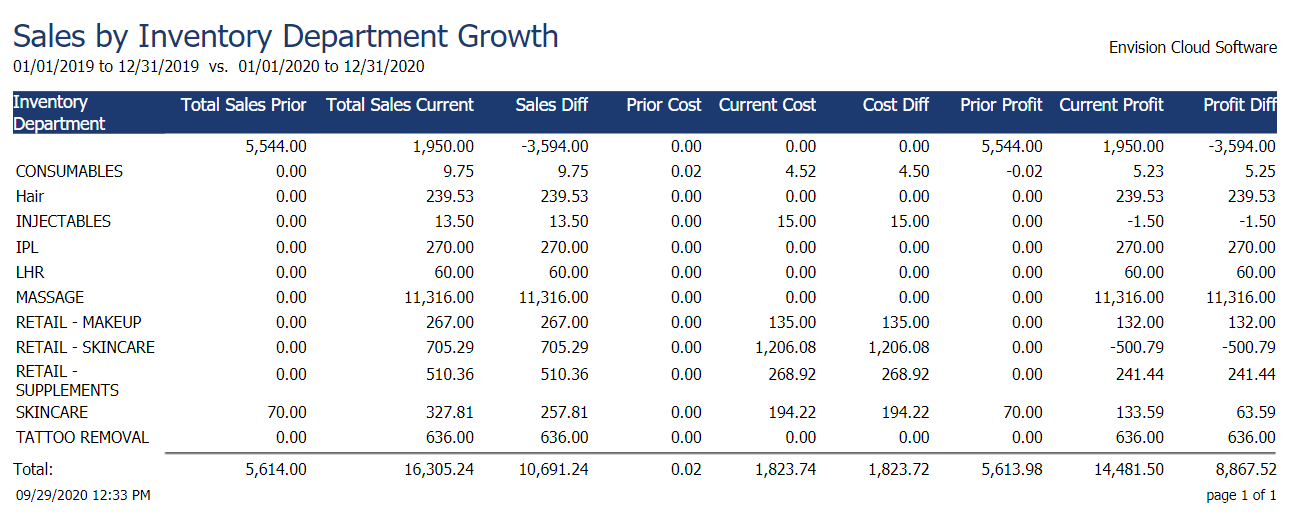
Sales by Inventory Department Growth Report
The Sales by Inventory Department Growth Report compares inventory department sales, costs, and profits from different periods of time. This allows your business to see the profitability of different inventory departments over time and compared to one another.
Options Include:
- Date Ranges
- Graph Options
- Inventory Type
- All or Single Client
- All or Single Lead Source
- All or Single Employee
- Team Selection (Ultimate Only)
- All or Single Employee Department
- All or Single Item
- All or Single Inventory Department
- All or Single Inventory Class
- All or Single Vendor
- All or Single Manufacturer
- Sort By Options
- Company Selection (For multi-location businesses)
This report displays the following information:
- Inventory Department
- Total Sales Prior
- Total Sales Current
- Sales Difference
- Prior Cost
- Current Cost
- Cost Difference
- Prior Profit
- Current Profit
- Profit Difference
Report Example:
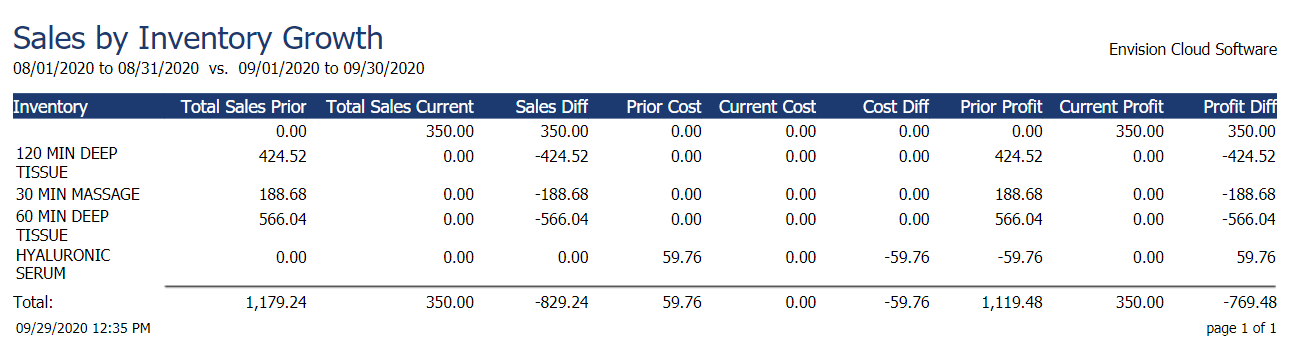
Sales by Inventory Growth Report
The Sales by Inventory Growth Report compares inventory sales, costs, and profits from different periods of time. This allows your business to see the profitability of different inventory items compared to one another and over time.
Options Include:
- Date Ranges
- Graph Options
- Inventory Type
- All or Single Client
- All or Single Lead Source
- All or Single Employee
- Team Selection (Ultimate Only)
- All or Single Employee Department
- All or Single Item
- All or Single Inventory Department
- All or Single Inventory Class
- All or Single Vendor
- All or Single Manufacturer
- Sort By Options
- Company Selection (For multi-location businesses)
This report displays the following information:
- Inventory
- Total Sales Prior
- Total Sales Current
- Sales Difference
- Prior Cost
- Current Cost
- Cost Difference
- Prior Profit
- Current Profit
- Profit Difference
Report Example:
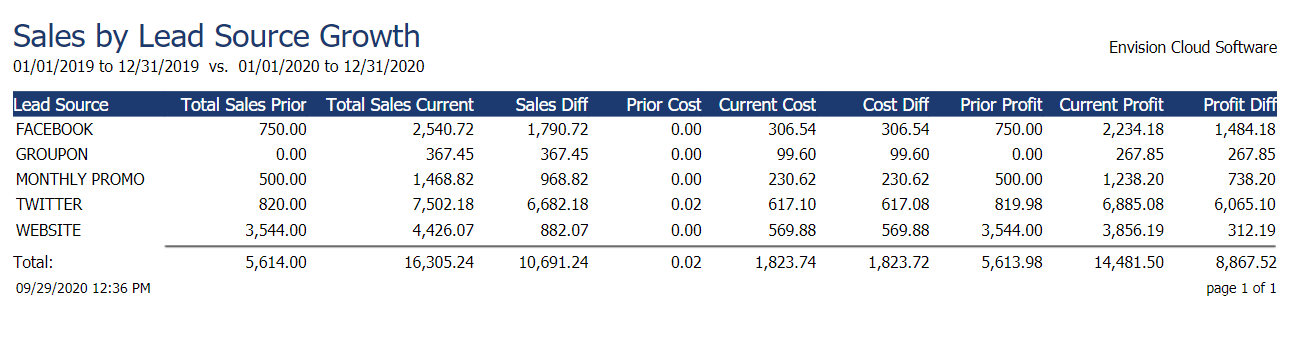
Sales by Lead Source Growth Report
The Sales by Lead Source Growth Report compares the sales, costs, and profits associated with different lead sources from different periods of time. This allows your business to see the profitability of different lead sources over time and compared to one another. This report could be helpful in deciding which marketing tactics to focus on!
Options Include:
- Date Ranges
- Graph Options
- Inventory Type
- All or Single Client
- All or Single Lead Source
- All or Single Employee
- Team Selection (Ultimate Only)
- All or Single Employee Department
- All or Single Item
- All or Single Inventory Department
- All or Single Inventory Class
- All or Single Vendor
- All or Single Manufacturer
- Sort By Options
- Company Selection (For multi-location businesses)
This report displays the following information:
- Lead Source
- Total Sales Prior
- Total Sales Current
- Sales Difference
- Prior Cost
- Current Cost
- Cost Difference
- Prior Profit
- Current Profit
- Profit Difference
Report Example:
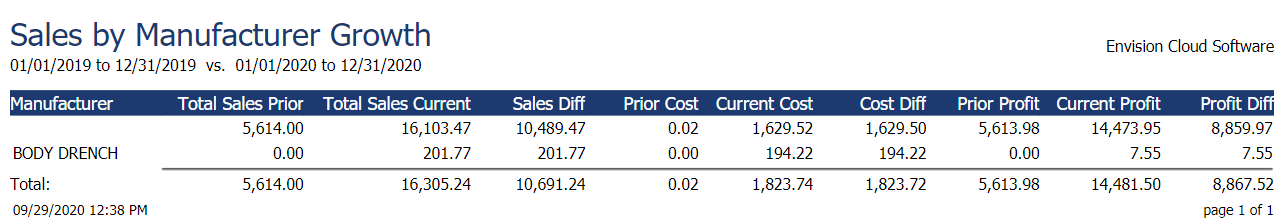
Sales by Manufacturer Growth Report
The Sales by Manufacturer Growth Report compares sales, costs, and profits associated with various manufacturers over different periods of time. This allows your business to see the profitability of working with certain manufacturers compared to previous time periods.
Options Include:
- Date Ranges
- Graph Options
- Inventory Type
- All or Single Client
- All or Single Lead Source
- All or Single Employee
- Team Selection (Ultimate Only)
- All or Single Employee Department
- All or Single Item
- All or Single Inventory Department
- All or Single Inventory Class
- All or Single Vendor
- All or Single Manufacturer
- Sort By Options
- Company Selection (For multi-location businesses)
This report displays the following information:
- Manufacturer
- Total Sales Prior
- Total Sales Current
- Sales Difference
- Prior Cost
- Current Cost
- Cost Difference
- Prior Profit
- Current Profit
- Profit Difference
Report Example:
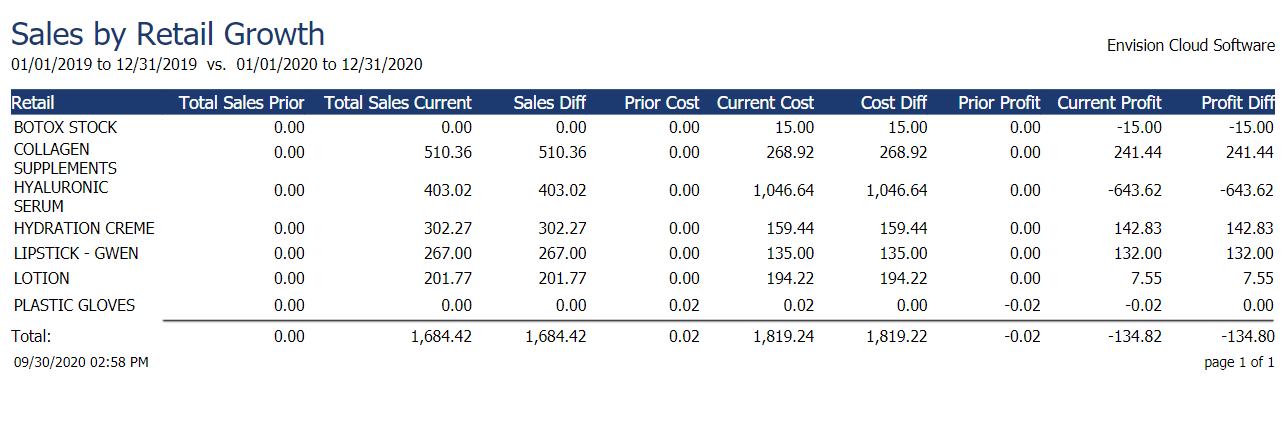
Sales by Retail Growth Report
The Sales by Retail Growth Report compares retail item sales, costs, and profits from different periods of time. This allows your business to see the profitability of different retail items over time and compared to one another. This report could aid in deciding which retail items to continue carrying in your business.
Options Include:
- Date Ranges
- Graph Options
- Inventory Type
- All or Single Client
- All or Single Lead Source
- All or Single Employee
- Team Selection (Ultimate Only)
- All or Single Employee Department
- All or Single Item
- All or Single Inventory Department
- All or Single Inventory Class
- All or Single Vendor
- All or Single Manufacturer
- Sort By Options
- Company Selection (For multi-location businesses)
This report displays the following information:
- Retail
- Total Sales Prior
- Total Sales Current
- Sales Difference
- Prior Cost
- Current Cost
- Cost Difference
- Prior Profit
- Current Profit
- Profit Difference
Report Example:
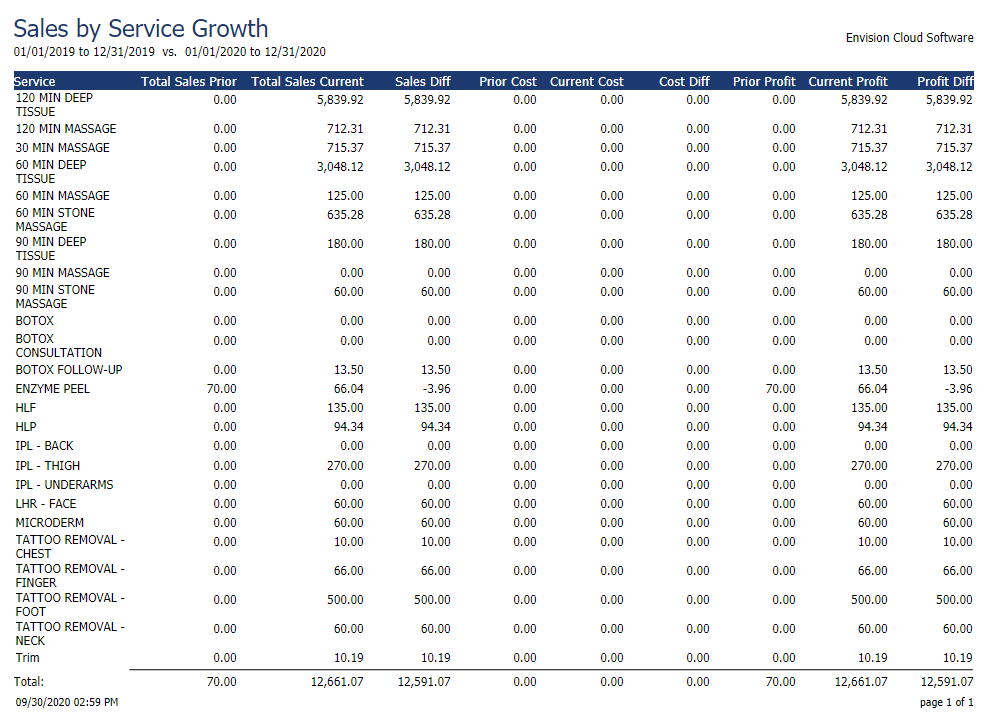
Sales by Service Growth Report
The Sales by Service Growth Report compares service sales, costs, and profits from different periods of time. This allows your business to see the profitability of different services over time and compared to one another. The report can give your business insight into the services that are growing in popularity among clients.
Options Include:
- Date Ranges
- Graph Options
- Inventory Type
- All or Single Client
- All or Single Lead Source
- All or Single Employee
- Team Selection (Ultimate Only)
- All or Single Employee Department
- All or Single Item
- All or Single Inventory Department
- All or Single Inventory Class
- All or Single Vendor
- All or Single Manufacturer
- Sort By Options
- Company Selection (For multi-location businesses)
This report displays the following information:
- Service
- Total Sales Prior
- Total Sales Current
- Sales Difference
- Prior Cost
- Current Cost
- Cost Difference
- Prior Profit
- Current Profit
- Profit Difference
Report Example:
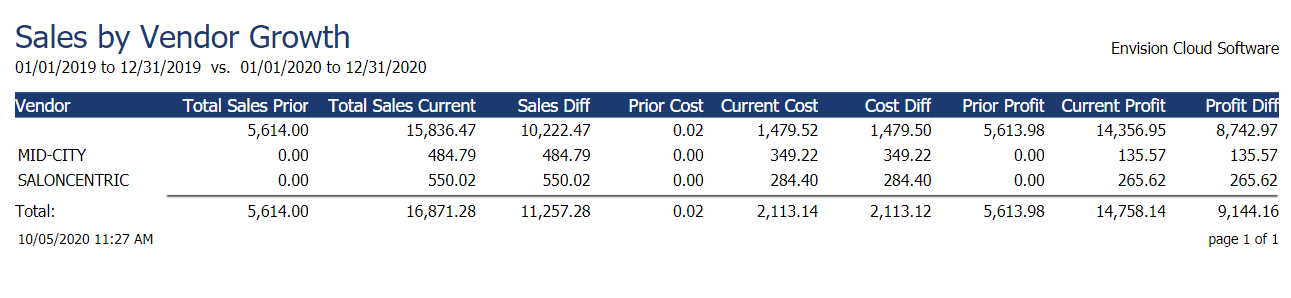
Sales by Vendor Growth Report
The Sales by Vendor Growth Report compares sales, costs, and profits associated with various vendors over different periods of time. This allows your business to see the profitability of working with certain vendors compared to previous time periods and aid in the inventory ordering decision-making process.
Options Include:
- Date Ranges
- Graph Options
- Inventory Type
- All or Single Client
- All or Single Lead Source
- All or Single Employee
- Team Selection (Ultimate Only)
- All or Single Employee Department
- All or Single Item
- All or Single Inventory Department
- All or Single Inventory Class
- All or Single Vendor
- All or Single Manufacturer
- Sort By Options
- Company Selection (For multi-location businesses)
This report displays the following information:
- Vendor
- Total Sales Prior
- Total Sales Current
- Sales Difference
- Prior Cost
- Current Cost
- Cost Difference
- Prior Profit
- Current Profit
- Profit Difference
Report Example: